
Figure 6.
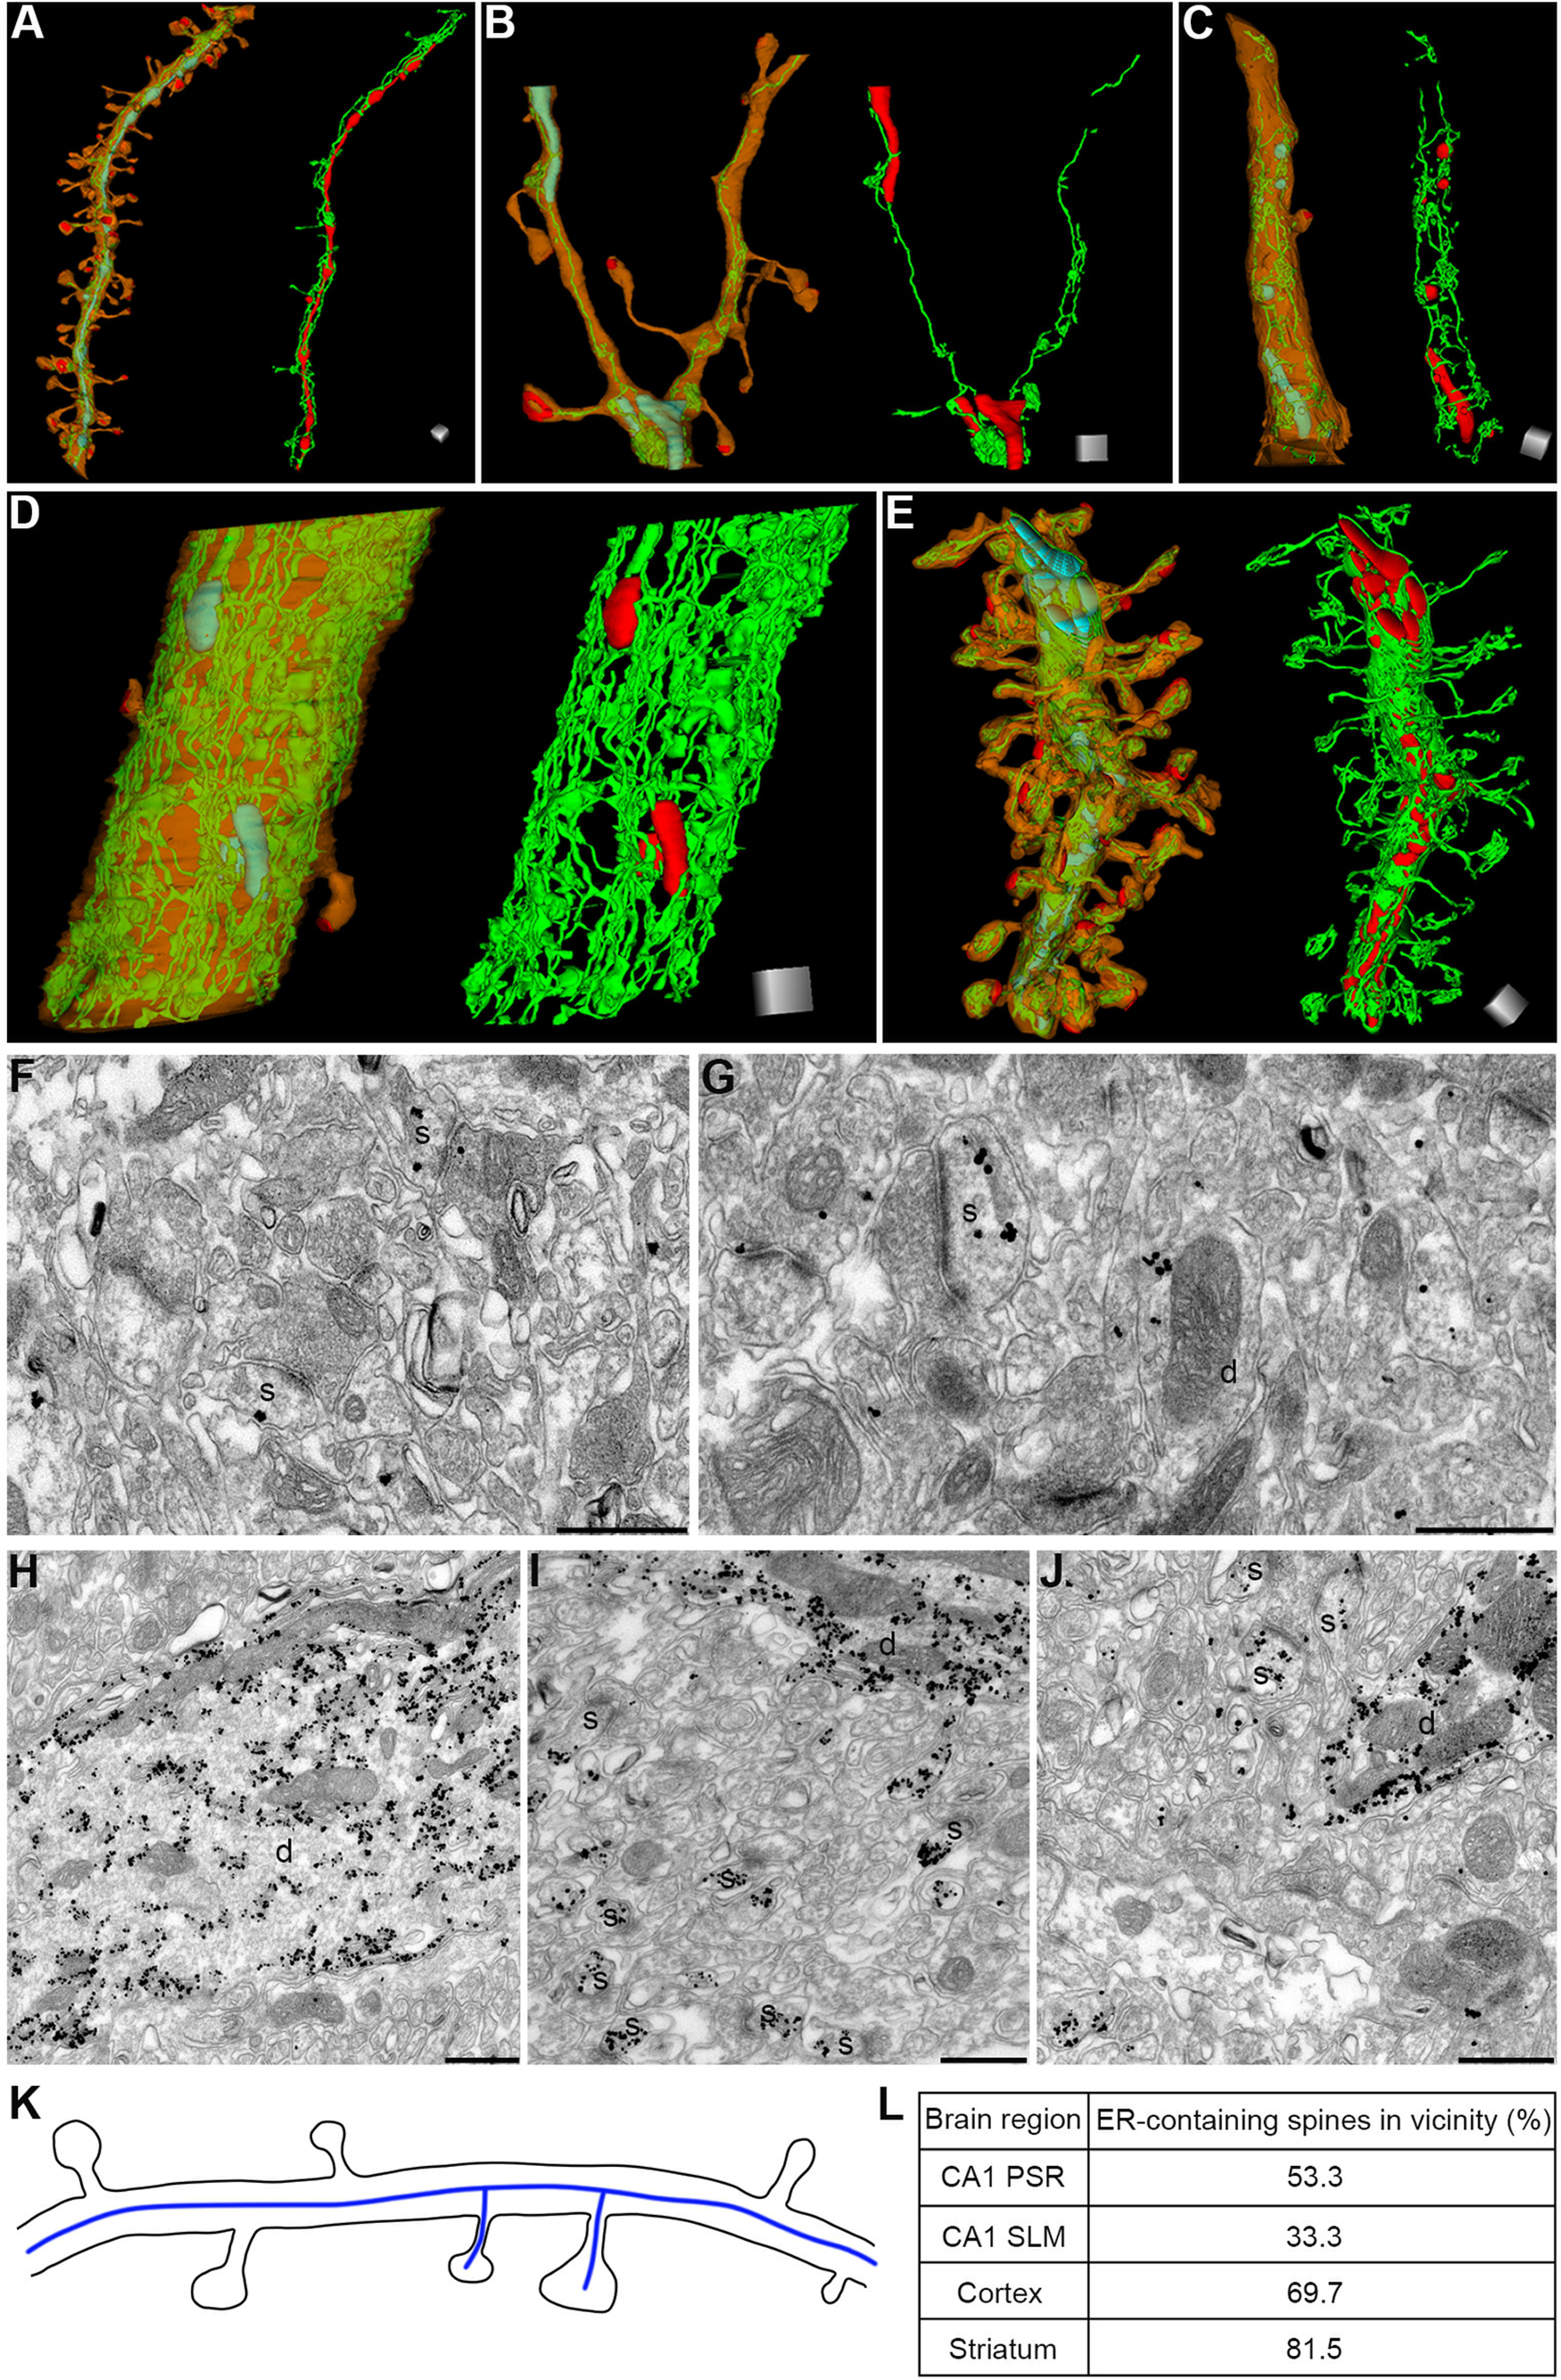
Distribution of ER in dendrites and spines. 3D reconstruction showing ER (green) and mitochondria (turquoise) in an oblique dendrite in the CA1 PSR (A), cortical dendrite (B), striatal dendrite (C), large-caliber dendrite in the CA1 PSR (D), and Purkinje cell dendrite in the CB (E). ER (green) is a continuous structure along the dendrite (orange) and extends into spines in all the brain regions. Dendrites, spines, PSDs (red), ER (green), and mitochondria (turquoise) are shown on the left-hand side, and only ER (green) and mitochondria (red) for the same dendrite are shown on the right-hand side in each panel in A–E. TEM images showing immunoreactivity for IP3R1 in the dendrites (d) and spines (s) of the cortex (F), striatum (G), and CB (H–J). The schematic diagram in K shows that the ER (blue line) is continuous along the dendrite and extends into spines. Panel L shows that in >50% of the cases, ER-containing spines are located next to one another in the CA1 PSR, cortex, and striatum. Scale cubes: 0.5 μm (A–E, for each side). Scale bars: 500 nm (F–J).