
Figure 5.
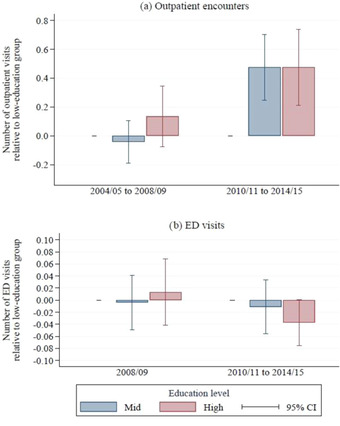
Relative Outpatient Hospital Use, 2004‐2009 vs 2010‐2015, by Education Group, Adjusted for Demographic and Health Characteristicsa [Color figure can be viewed at wileyonlinelibrary.com]
aEducation is classified as low (no formal qualifications), mid (completed compulsory education), or high (at least some higher education). All measures of hospital use are calculated relative to use among those in the low‐education group, adjusting for English Longitudinal Study of Ageing wave (year), individual demographic characteristics (age, age 2 , sex, being non‐white, being in a couple, being in paid work, and interaction effects between sex and age and sex and being nonwhite), and individual health characteristics (self‐reported general health [fair/poor, good, or very good], scoring ≥4 on the 8‐item Centre for Epidemiologic Studies Depression Scale, difficulties with mobility, difficulties with activities of daily living, difficulties with instrumental activities of daily living, reporting a long‐standing illness, reporting a long‐standing and limiting illness, being in receipt of informal long‐term care, being in receipt of formal long‐term care, whether the individual died in the two years following the interview, and whether the individual was ever diagnosed with lung disease, asthma, arthritis, osteoporosis, cancer, Parkinson's disease, psychiatric problems, Alzheimer's disease, dementia, a blood disorder, hypertension, angina, heart attack, congestive heart failure, heart murmur, heart arrhythmia, diabetes, stroke, or high cholesterol).