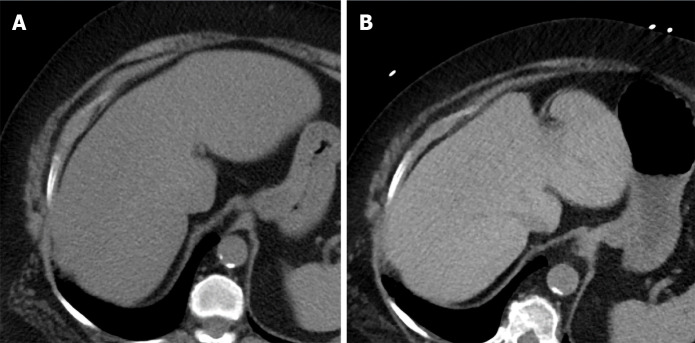
Figure 2.
Pre- vs post-treatment computed tomography scans of the liver. A: Liver computed tomography (CT) scan before treatment with proprotein convertase subtilisin/kexin type-9 (PCSK9) inhibitor, showing the liver to be homogeneously hypodense (< 40 HU) and the portal and hepatic veins to have unclear delineation from the surrounding parenchyma; B: Liver CT scan after treatment with PCSK9 inhibitor, showing the liver to have increased density and the portal and hepatic veins to be clear (i.e., linear hypodense structures, in contrast to the more hyperdense liver parenchyma).

