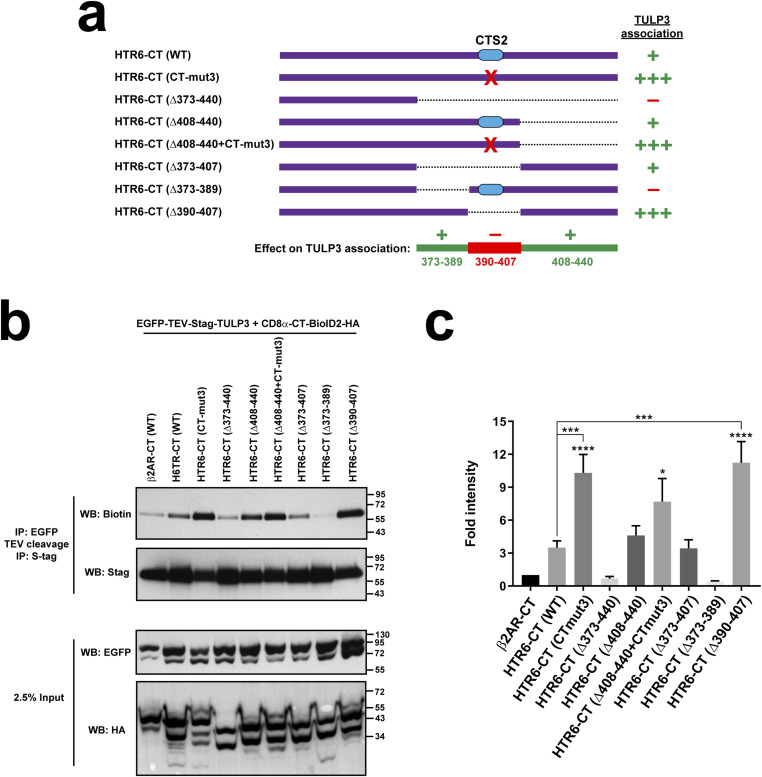
Figure 10. HTR6 CTS2 antagonizes TULP3 association to HTR6-CT.
(A) Schematic of the CD8α (aa 1–206)-(HTR6-CT)-BioID2-HA constructs used here, showing only the HTR6-CT moiety. The CTS2 is shown as a blue oval and red crosses indicate the CT-mut3 mutation. Dashed lines indicate deleted regions. The intensity of TULP3 association is displayed on the right. At bottom, the regions in HTR6-CT promoting TULP3 association are shown in green, and the CTS2-containing region antagonizing TULP3 association is shown in red. (B) SDS–PAGE and WB analysis of tandem immunoprecipitated S-tagged TULP3 (top two panels) and of cleared cell lysates (bottom two). In the IPs, NeutrAvidin-HRP was used to detect TULP3 biotinylation (top) and anti-Stag antibody to detect its total levels. In the lysates, anti-EGFP and anti-HA tag antibodies were used to detect EGFP-TEV-Stag-TULP3 and CD8 fusions, respectively. Molecular weight markers on the right (kD). (B, C) Quantitation from (B) of biotinylated TULP3 signal, relative to total TULP3 in IP, and normalized to β2AR-CT sample. Data are mean ± SEM (n = 7, 6, 7, 5, 5, 3, 5, 4, 4 independent experiments, from left to right). Data were analyzed by one-way ANOVA followed by Tukey’s multiple comparisons tests. Significance shown as P < 0.05(*), P < 0.001(***), or P < 0.0001(****). Where not explicitly indicated, asterisks represent significance relative to β2AR-CT.
Source data are available for this figure.

