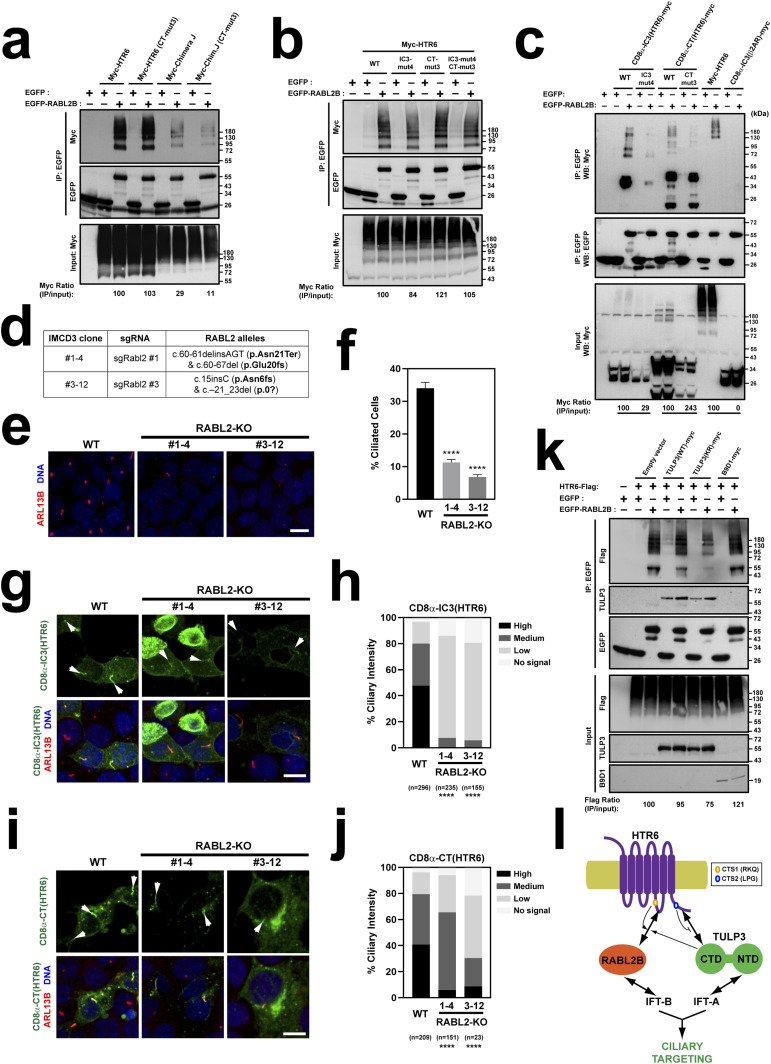
Figure 12. RABL2 regulates HTR6 ciliary targeting mostly via CTS1.
(A) Lysates from HEK293T cells expressing the proteins indicated at the top were immunoprecipitated with anti-EGFP antibodies and analyzed by Western blot with anti-Myc and anti-EGFP antibodies, as indicated. At bottom, Myc signal immunoprecipitated by EGFP-RABL2 is quantitated relative to Myc signal in the corresponding lysate, and normalized relative to Myc-HTR6 (100%). Molecular weight markers are shown on the right. Input is 2.5% of lysate used for IP. (A, B) Co-IP experiment as in (A), but with the constructs indicated at the top. (A, C) Co-IP experiment as in (A), but with the constructs indicated at the top. In the quantitations below, each mutant is normalized to its respective control (and β2AR-IC3 is normalized to HTR6). (D) Genomic characterization of the two CRISPR-generated RABL2-KO IMCD3 clones used in this figure. Allele nomenclature corresponds to Ensembl mouse transcript Rabl2-201 and follows Human Genome Variation Society (HGVS) guidelines (52). (E) Ciliogenesis is strongly reduced in RABL2-KO clones, as seen by immunostaining with ARL13B (red) antibodies. DAPI in blue. Scale bar, 10 μm. (E, F) Percentage of ciliated cells was quantitated from (E). Data are mean ± SEM of n = 12 fields of cells, each containing at least 30 cells, from two coverslips. Data were analyzed by one-way ANOVA with Tukey’s multiple comparisons tests (P < 0.0001 (****)). (G) EYFP-tagged CD8α-IC3(HTR6) was transfected into RABL2-KO clones, or WT IMCD3 cells as control, and its ciliary localization assessed by immunostaining with EGFP (green) and ARL13B (red) antibodies. DAPI-stained nuclei in blue. CD8α-IC3(HTR6) levels are very low or undetectable in RABL2-KO cilia (arrows). Scale bar, 10 μm. (G, H) Quantitation of CD8α-IC3(HTR6) ciliary intensity from (G). Percentage of cilia in each of the indicated categories is shown. Number of transfected cell cilia counted in each condition is displayed at the bottom, together with statistical significance from chi-square tests comparing each mutant distribution to that of WT (P < 0.0001 (****)). (G, I) Same analysis as in (G) was performed for CD8α-CT(HTR6)-EYFP. Arrows point to cilia. Scale bar, 10 μm. (H, I, J) Quantitation of CD8α-CT(HTR6) ciliary intensity from (I) was performed and analyzed as in (H). (A, K) Co-IP experiment as in (A) but with the indicated constructs and antibodies. (L) Model of HTR6 ciliary targeting. Double-headed arrows represent physical interactions. Single-headed arrows represent positive effects. Also shown is the antagonism of CTS2 on TULP3 binding to HTR6-CT. We hypothesize CTS2 promotes intraciliary dissociation of TULP3, thereby freeing it for further rounds of transport. Whether HTR6-IC3 directly binds to IFT-A, as shown for SSTR3-IC3, remains unknown (48).
Source data are available for this figure.

