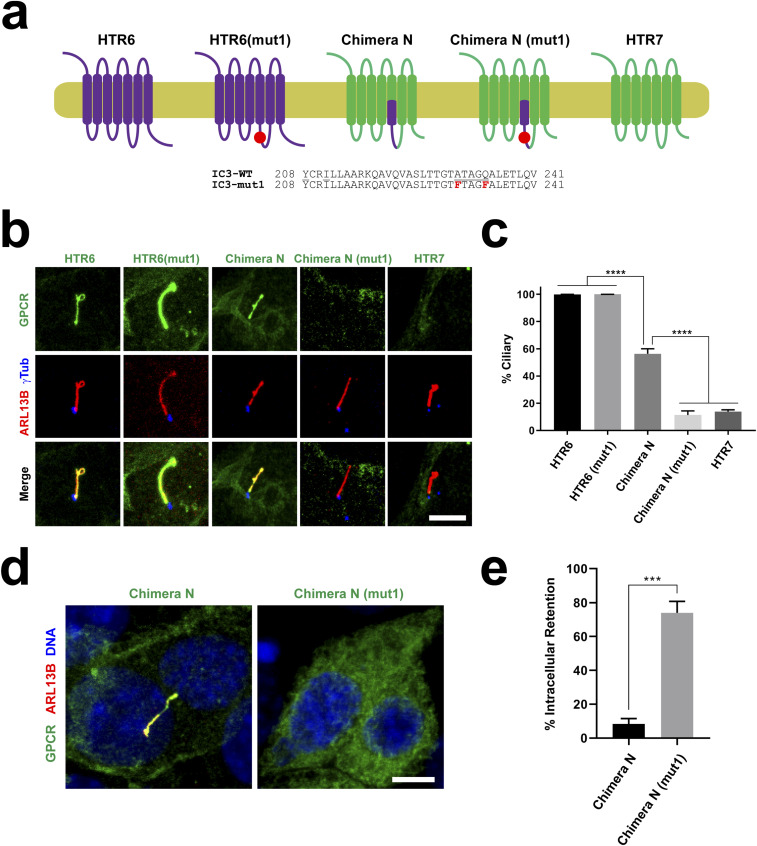
Figure 2. The ATAGQ motif in HTR6-IC3 is dispensable for ciliary targeting of wild-type HTR6.
(A) Schematic representation of HTR7 (green), HTR6 (purple), Chimera N, and the mutant versions of the latter two, carrying the A230F+Q234F double mutation (mut1) in the first half of HTR6’s IC3 loop, whose sequence is shown below. (A, B) The G protein–coupled receptors (GPCRs) from (A), with EGFP fused to their C-termini, were expressed in IMCD3 cells and their cilia localization was analyzed by immunofluorescence with antibodies against EGFP (green), ARL13B (red) and gamma-tubulin (γTub, blue). Scale bar, 5 μm. (B, C) Percentage of GPCR-positive cilia in GPCR-transfected cells was quantitated from (B). Data are mean ± SEM of n = 3 to 5 independent experiments per construct, in each of which at least 50 transfected-cell cilia were counted for each GPCR. Data were analyzed by one-way ANOVA followed by Tukey’s multiple comparisons tests. Significance is indicated as P < 0.0001 (****). (D) Immunofluorescence pictures of Chimera N and Chimera N (mut1) showing the latter’s intracellular retention. Scale bar, 5 μm. (E) Percentage of transfected cells where indicated chimera was retained intracellularly with no observable plasma membrane staining was quantitated from immunofluorescence experiments. Data are mean ± SEM of n = 3 independent experiments, each with at least 150 transfected cells counted per chimera. Significance in unpaired two-tailed t test shown as P < 0.001 (***).

