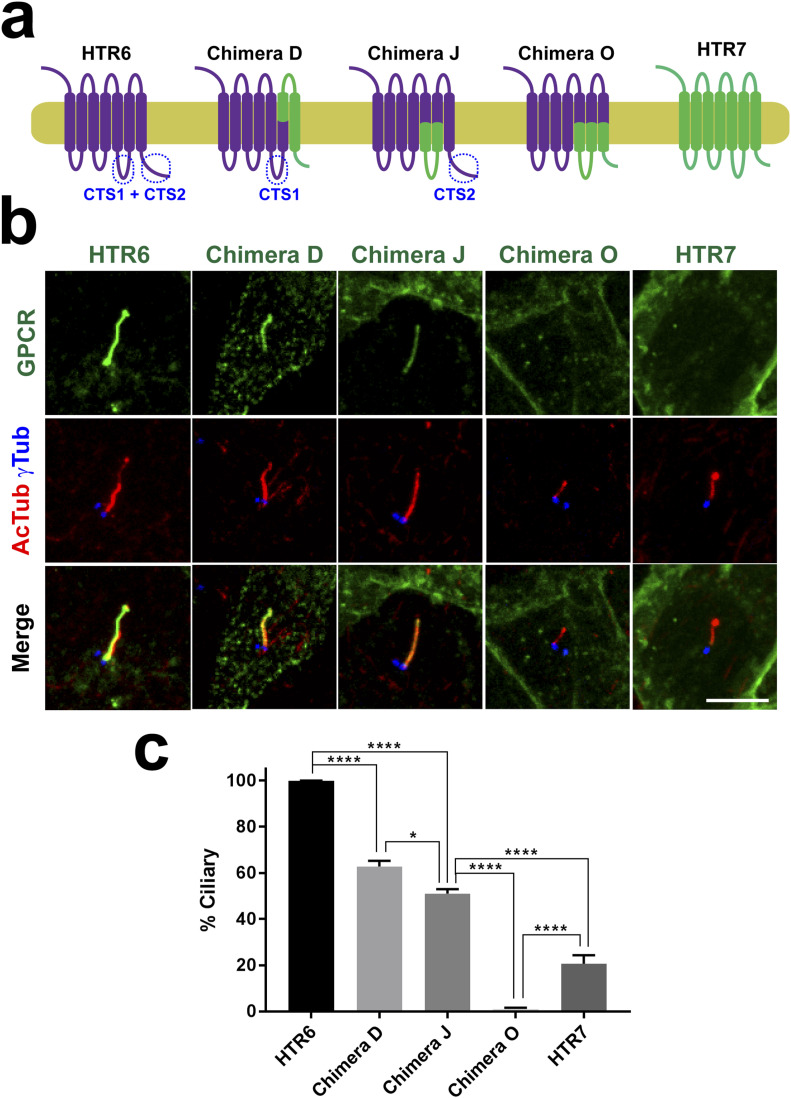
Figure 3. HTR6 ciliary targeting relies on redundancy between IC3 loop (CTS1) and C-terminal tail (CTS2) sequences.
(A) Schematic representation of HTR6 (purple), HTR7 (green) and their chimeras, wherein purple segments come from HTR6 and green ones from HTR7. Ciliary targeting sequences in IC3 loop (CTS1) and C-terminal tail (CTS2) are labeled where present. (A, B) The G protein-coupled receptors (GPCRs) from (A), with EGFP fused to their C-termini, were expressed in IMCD3 cells and their cilia localization was analyzed by immunofluorescence with antibodies against EGFP (green), acetylated tubulin (AcTub, red) and gamma-tubulin (γTub, blue). Scale bar, 5 μm. (B, C) Percentage of GPCR-positive cilia in GPCR-transfected cells was quantitated from (B) as described in the Materials and Methods section. Data are mean ± SEM of n = 5, 3, 5, 5, 8 (from left to right) independent experiments, in each of which at least 50 transfected-cell cilia were counted for each GPCR. One-way ANOVA followed by Tukey’s multiple comparison tests shows all samples are significantly different from each other with P < 0.0001 (****) or P < 0.05 (*), as indicated.

