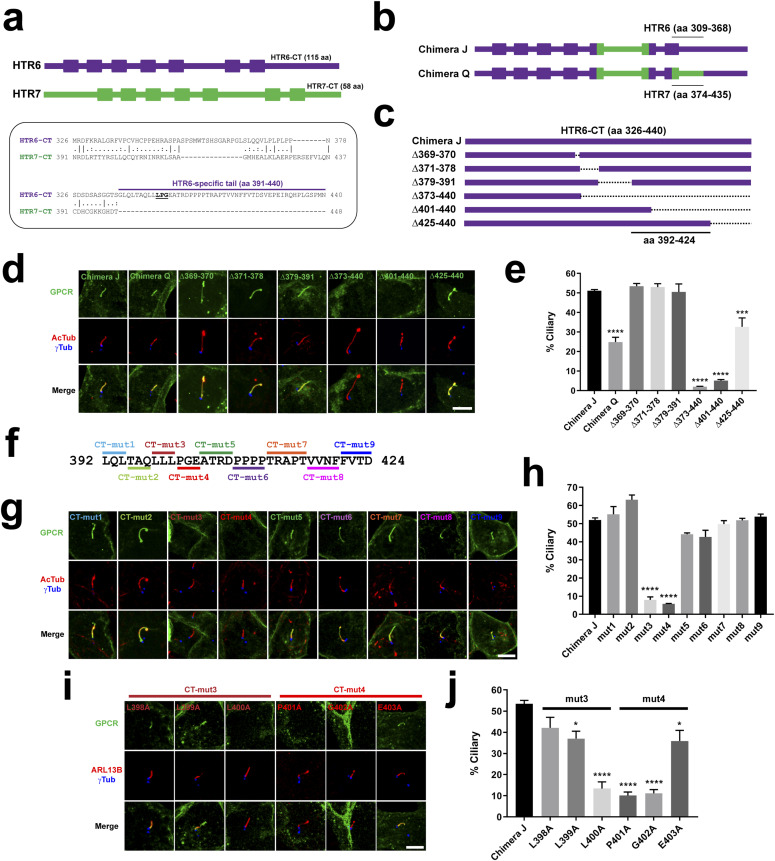
Figure 4. An LPG motif is critical for the ciliary targeting function of HTR6’s CTS2.
(A) Top: schematic depiction of HTR6 (440 aa, purple) and HTR7 (448 aa, green) with transmembrane helices displayed as boxes. Notice how HTR6 C-terminal tail (CT) is twice as long as HTR7-CT (115 aa versus 58 aa). Bottom: alignment of HTR6-CT and HTR7-CT. The former is 10-fold richer in prolines (17% versus 1.7%) and its latter half (aa 391–440) has no homologous counterpart in HTR7. LPG motif inside HTR6-specific tail is underlined. (B) Schematic representation of Chimera J and Chimera Q. They are identical except that Chimera Q lacks the HTR6 residues indicated in Chimera J, and contains instead the HTR7 residues indicated in Chimera Q. (C) Schematic showing HTR6-CT on top (present in Chimera J), and the deletions that were introduced into Chimera J, covering all residues that had not been substituted in Chimera Q. Indicated at the bottom is the critical region required for ciliary targeting of Chimera J. (B, C, D) IMCD3 cells expressing the constructs from (B, C), all fused to EGFP in their C termini, were analyzed by immunofluorescence with antibodies against EGFP (green), acetylated tubulin (AcTub, red) and gamma-tubulin (γTub, blue). Scale bar, 5 μm. (D, E) Percentage of G protein–coupled receptor (GPCR)–positive cilia relative to total transfected-cell cilia was quantitated from (D). (C, F) Nine separate mutations (CT-mut1 to CT-mut9) were introduced into critical region from (C), with all indicated residues replaced by alanines. (D, G) IMCD3 cells expressing C-terminally EGFP-tagged mut1-mut9 Chimera J mutants were analyzed as in (D). Scale bar, 5 μm. (E, G, H) Percentage of GPCR-positive cilia from (G) was quantitated as in (E). (D, I) The residues mutated in CT-mut3 and CT-mut4 were individually substituted to alanine and analyzed as in (D). (E, I, J) Percentage of GPCR-positive cilia from (I) was quantitated as in (E). In all quantitations, data are mean ± SEM of n = 3–5 independent experiments per construct, with at least 50 cilia counted per construct and experiment. Statistical analysis was performed by one-way ANOVA followed by Tukey’s multiple comparisons tests. Significance is indicated as P < 0.05(*), P < 0.001(***), or P < 0.0001(****).

