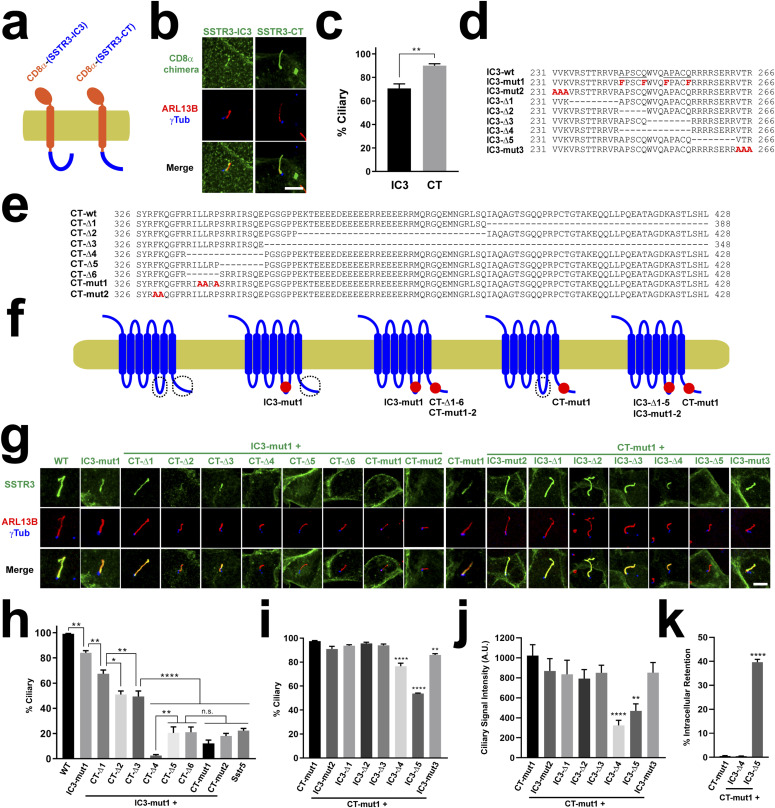
Figure 7. SSTR3 ciliary targeting also depends on redundant ciliary targeting sequences in IC3 and CT.
(A) Schematic of CD8α(1-206) chimeras fused to SSTR3-IC3 or SSTR3-CT. (A, B) IMCD3 cells expressing C-terminally EYFP-tagged constructs from (A) were analyzed by immunofluorescence with antibodies against EGFP/EYFP (green), ARL13B (red), and gamma-tubulin (γTub, blue). Scale bar, 5 μm. (B, C) Percentage of G protein-coupled receptor-positive cilia relative to total transfected-cell cilia was quantitated for the constructs in (B). Data are mean ± SEM of n = 4, 8 (IC3, CT) independent experiments per construct. Significance in unpaired two-tailed t test shown as P < 0.01(**). (D) SSTR3-IC3 wild-type sequence (top) and its mutated versions used below. The two reported Ax(A/S)xQ motifs are underlined in wild-type sequence. (E) SSTR3-CT wild-type sequence (top) and its mutated versions used below. (F) Schematic of SSTR3 and its mutants used below. CTS1 and CTS2 are encircled where intact. Mutations shown as red spots. (B, F, G) Ciliary targeting of SSTR3 mutants from (F) was analyzed as in (B). (C, G, H, I) Percentage of positive cilia for each of the indicated SSTR3 constructs from (G) was quantitated as in (C). (J) Intensity of ciliary staining was quantitated for the indicated SSTR3 constructs. (K) Percentage of cells with no detectable plasma membrane or ciliary staining was quantitated for indicated constructs. Data in (H, I, J, K) are mean ± SEM and were analyzed by one-way ANOVA followed by Tukey’s multiple comparison tests. Significance shown as P < 0.05(*), P < 0.01(**), P < 0.001(***), P < 0.0001(****) or not significant (n.s.). For (H), numbers of independent experiments per construct from left to right were n = 10, 3, 4, 3, 3, 3, 4, 4, 3, 4, 10. Equivalent numbers for (I) were n = 3, 4, 4, 5, 5, 5, 4, 4. For both (H, I), at least 50 cilia were counted per construct and experiment. For (J), intensity was measured in n = 26–59 cilia per condition in one representative experiment. For (K), n = 4 independent experiments per construct with at least 200 transfected cells assessed per construct and experiment.

