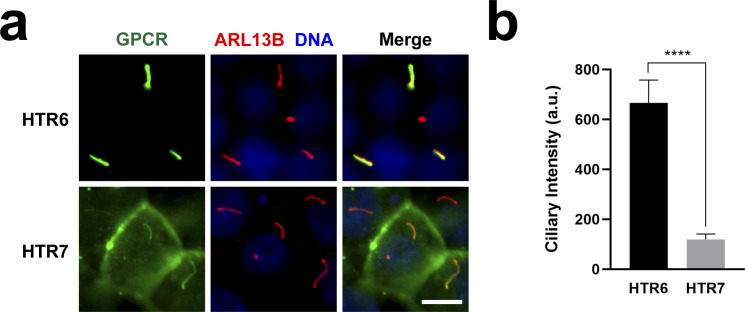
Figure S1. HTR6 labels cilia not only more frequently but also more intensely than HTR7.
(A) IMCD3 cells expressing HTR6-EGFP or HTR7-EGFP were analyzed by immunofluorescence with antibodies against EGFP (green) and ARL13B (red). DNA was stained with DAPI (blue). Scale bar, 10 μm. (A, B) Quantitation of ciliary intensity of G protein-coupled receptor-positive cilia from (A). Cilia showing no detectable G protein-coupled receptor staining were not included in the analysis (as shown in Figs 2 and 3, HTR7 only labels about 20% of cilia, whereas HTR6 labels virtually 100%). Data are mean ± SEM of n = 42 (HTR6) and n = 31 (HTR7) cilia. Significance is shown as P < 0.0001 (****) for an unpaired two-tailed t test.

