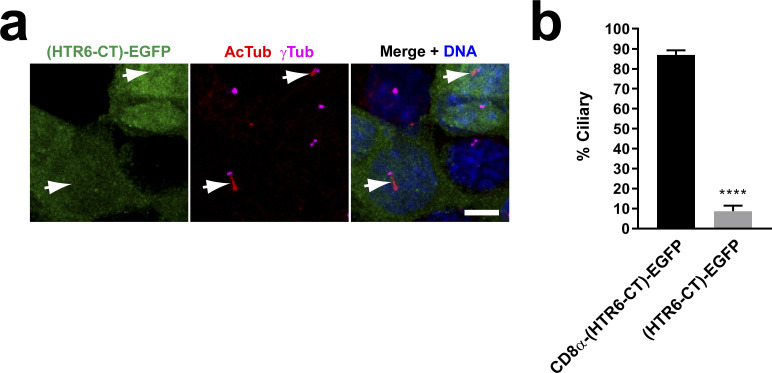
Figure S4. Membrane association is needed for HTR6-CT to function as a ciliary targeting sequence.
(A) IMCD3 cells expressing C-terminally EGFP-tagged HTR6-CT were analyzed by immunofluorescence with antibodies against EGFP (green), acetylated tubulin (AcTub, red) and γ-tubulin (γTub, magenta). DNA was stained with DAPI. Arrows indicate cilia. Scale bar, 5 μm. (A, B) Quantification of ciliary localization from (A). Data are mean ± SEM of n = 5 and n = 3 independent experiments for CD8α(1-206)-CT(HTR6)-EYFP and CT(HTR6)-EGFP, respectively. In each experiment, at least 50 transfected-cell cilia were counted for each construct. Significance in unpaired two-tailed t test is shown as P < 0.0001(****).

