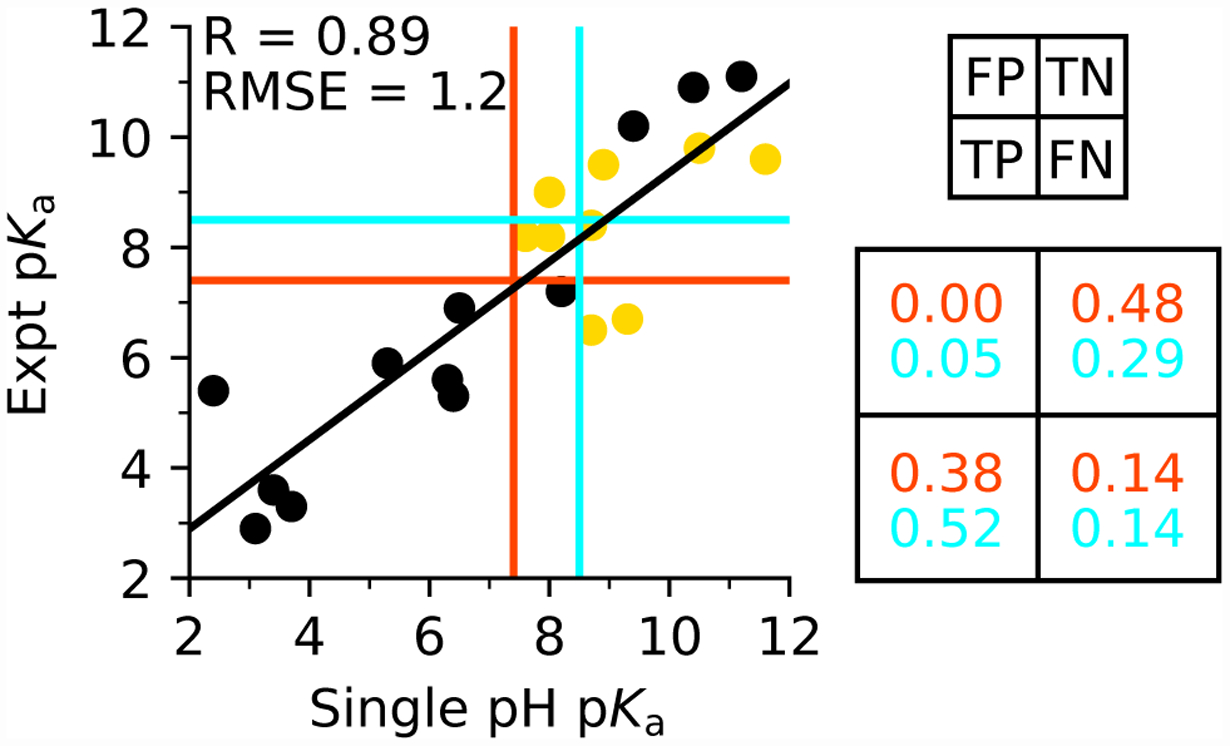
Figure 4: Performance of single-pH titrations for predicting cysteine pKa’s and identify thiolates at pH 7.5 or 8.5.

Comparison between experimental pKa’s and those obtained from 10-ns single-pH titrations of the entire data set of 21 proteins. Linear regression line is shown in black, and the correlation coefficient R and RMSE are given. Calculations based on crystal structures are shown in black, and those based on the computationally mutated structures in gold. The data are grouped into four quadrants around the dividing pH 7.4 (red) or pH 8.5 (cyan). A confusion matrix is shown on the right, with the rates for false positives (FP), true positives (TP), true negatives (TN), and false negatives (FN) given for thiolate predictions for pH 7.4 (red) and pH 8.5 (cyan). See main text for more explanation.
