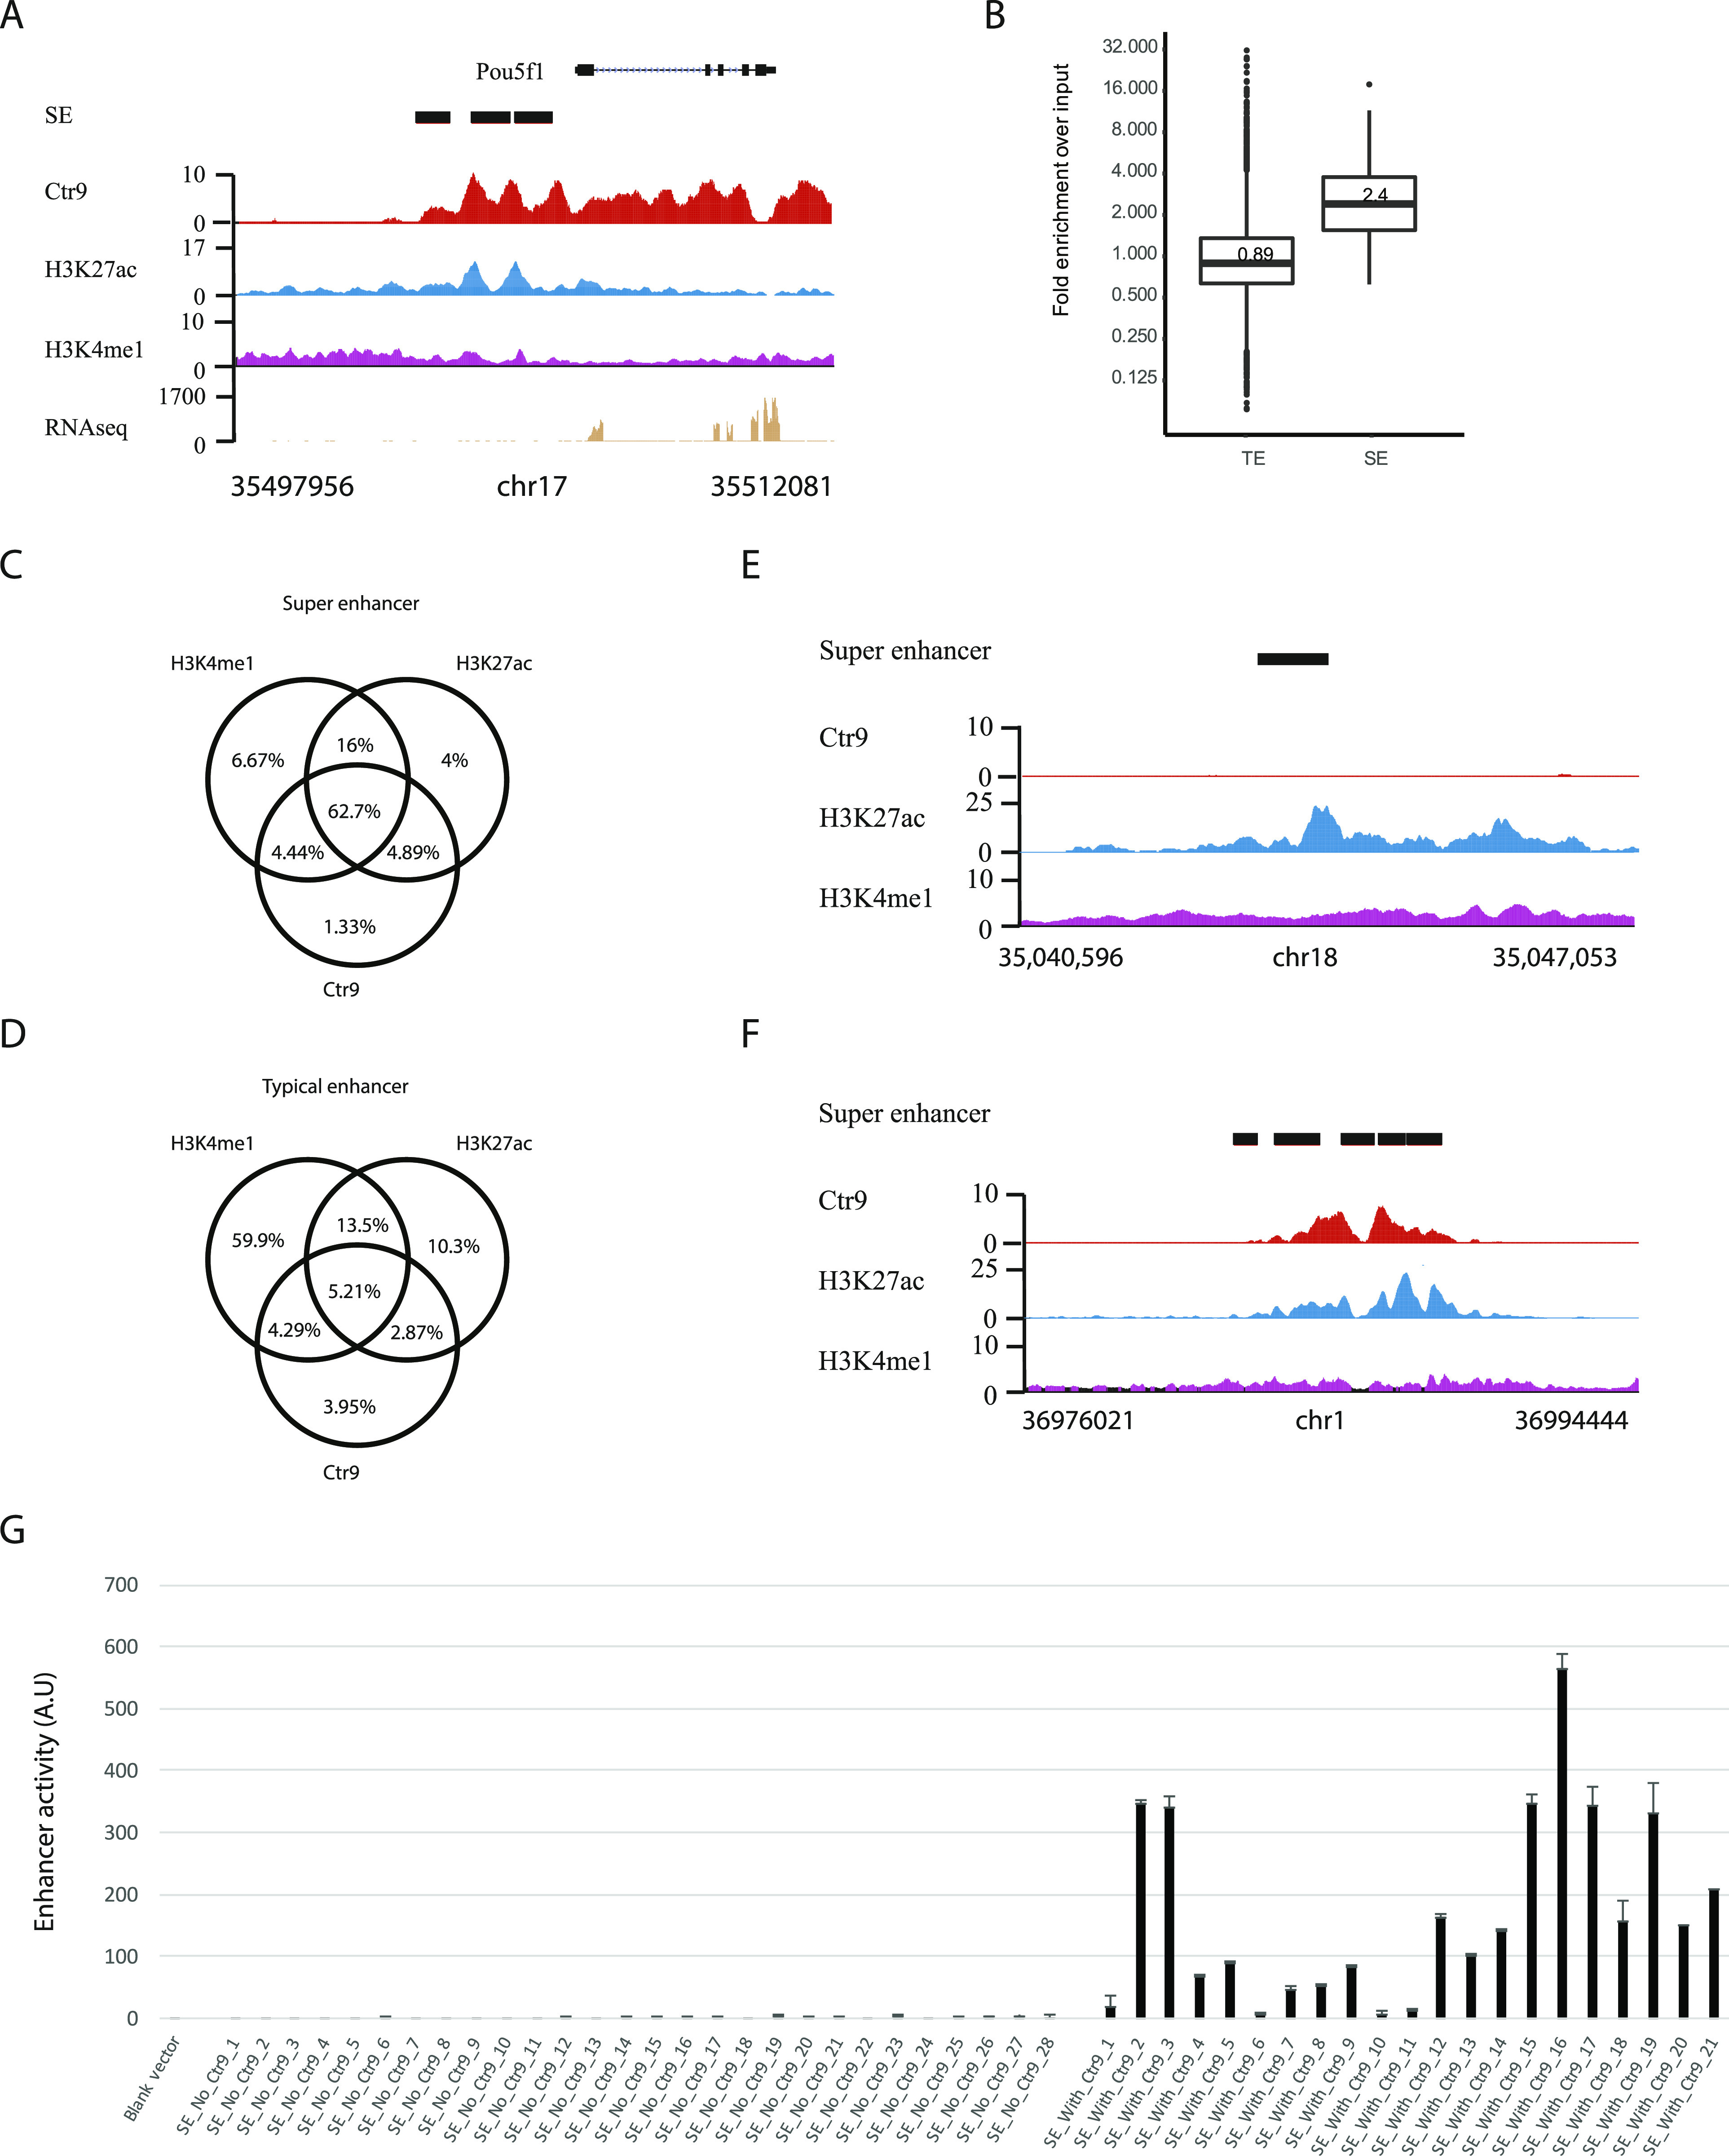
Figure 2. Paf1C is enriched at enhancers, and correlates with enhancer activities.

(A) Genome browser tracks of ChIP-seq results obtained for Ctr9, H3K27ac, and H3K4me1, and RNA-seq results in the vicinity of the Pou5f1 (Oct4) gene in mES cells. The x-axis indicates the chromosome position, and the y-axis represents normalized read density in reads per million. Black boxes indicate annotated Pou5f1 enhancers. Each ChIP-Seq experiment was performed with a single sample. (B) Box plots of Ctr9 binding densities on typical enhancers (TEs) and super enhancers (SEs). Significantly higher levels of Ctr9 binding was measured comparing SEs with TEs. P-value < 2.2 × 10⁻¹⁶ according to Wilcoxon rank sum test (SEs versus TEs). (C) Venn diagram analysis of H3K27ac, H3K4me1, Ctr9 occupancy on SEs. The numbers represent the percentages of SEs with corresponding histone modifications, and/or Ctr9 binding. (D) Venn diagram analysis of H3K27ac, H3K4me1, Ctr9 occupancy on TEs. The numbers represent the percentages of TEs with corresponding histone modifications, and/or Ctr9 binding. (E, F) Representative genome browser tracks for Ctr9, H3K27ac, and H3K4me1 at SEs without Ctr9 binding (E), or with Ctr9 binding (F). The x-axis indicates the chromosome position, and the y-axis represents normalized read density in reads per million. Black boxes indicate the annotated SEs. (G) Experimental evaluation of SE activities. Indicated DNA elements were tested to drive expression of the firefly luciferase gene. The y-axis shows the luciferase measurements in A.U. The values are normalized to samples transfected with the empty reporter vector. The pRL-SV40 plasmid was used as transfection efficiency control. Data are presented as the mean ± SD from three independent experiments. Error bars depict SD.
