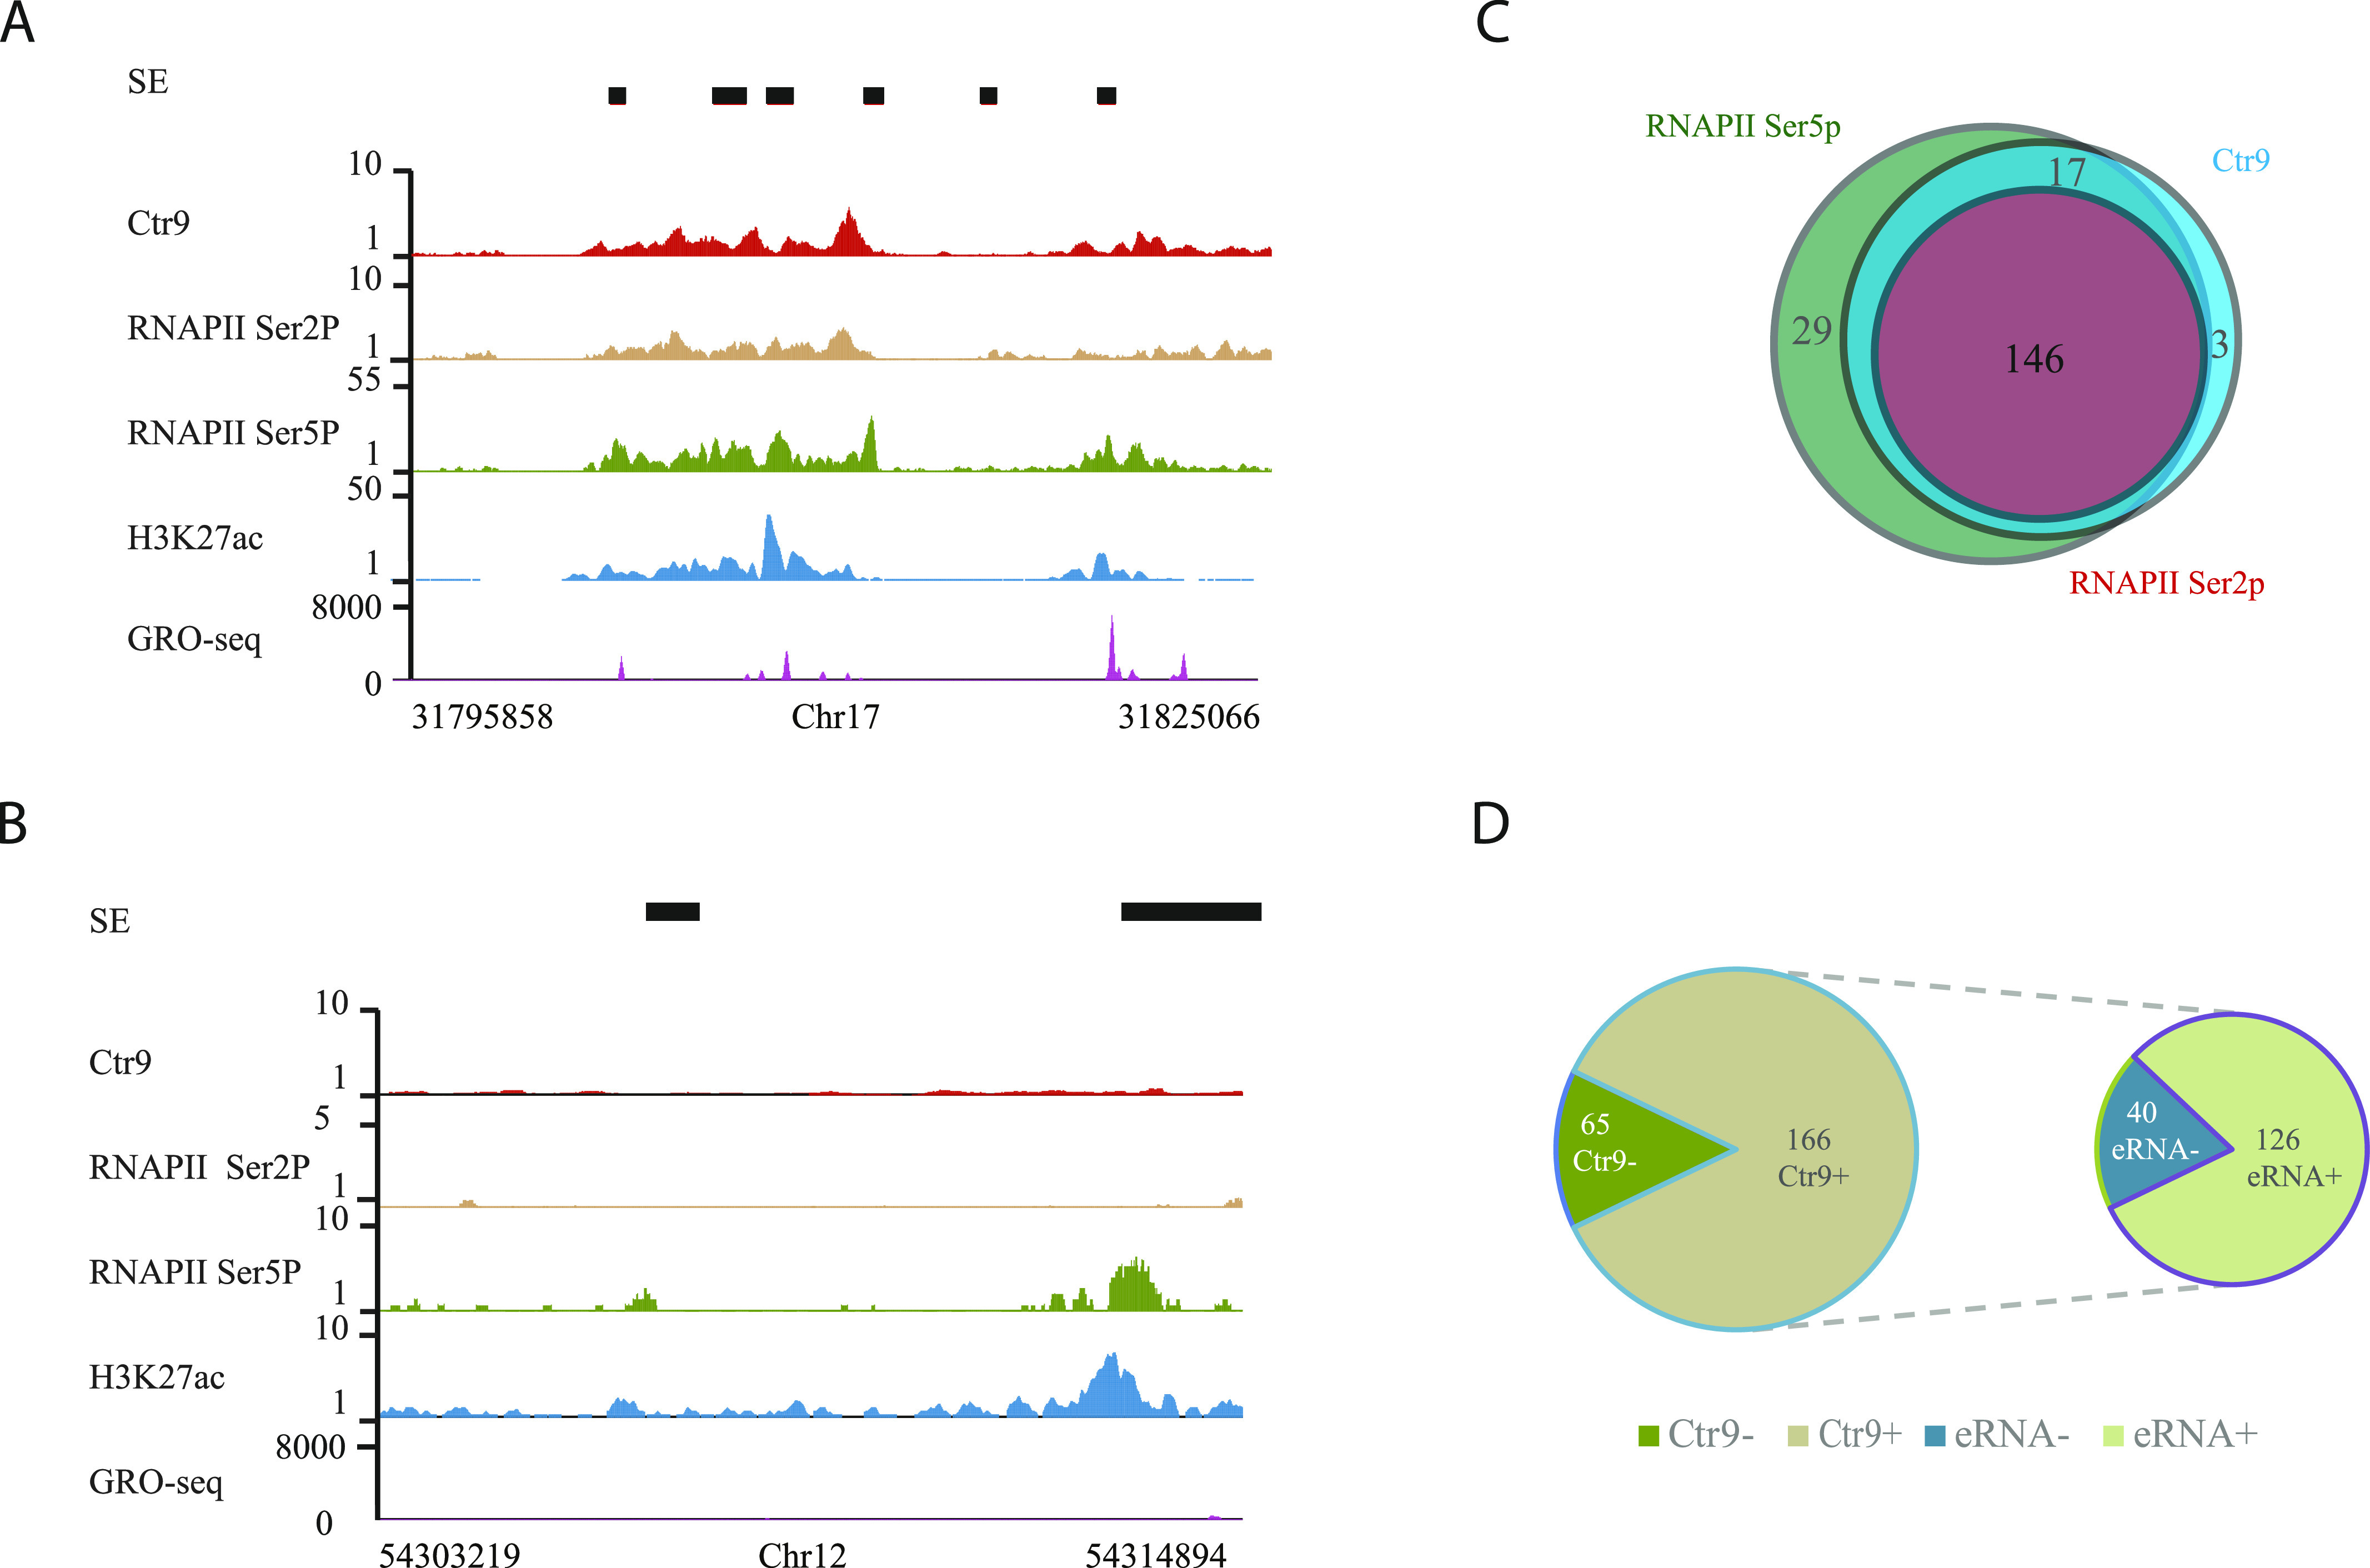
Figure 4. Paf1C and RNAPII Ser2p correlate with enhancer RNA (eRNA) transcripts.

(A, B) Representative genome browser tracks showing RNAPII Ser2p, RNAPII Ser5p, H3K27ac and eRNA on super enhancers (SEs) with Ctr9 binding (A) or without Ctr9 binding (B). (A, B) RNAPII Ser5p and H3K27ac are detectable in both (A) and (B), whereas RNAPII Ser2p and eRNA transcripts are detected only on SE with Ctr9 binding (A). The x-axis indicates the chromosome position, and the y-axis represents normalized read density in reads per million. Black boxes indicate annotated SEs. Each ChIP-Seq experiment was performed with a single sample. (C) Venn diagram analysis of RNAPII Ser2p, RNAPII Ser5p, and Ctr9 occupancy on SEs. The numbers indicate SEs carrying either histone modifications or Ctr9 binding. (D) Analysis of Ctr9 occupancy and eRNA transcripts on SEs. The numbers indicate SEs with Ctr9 binding and eRNA transcripts. The plot shows that all 126 eRNAs were transcribed from SEs with Ctr9 binding.
