
Figure S4. Ctr9, RNAPII Ser2p, and Ser5p occupancies at protein-coding genes.
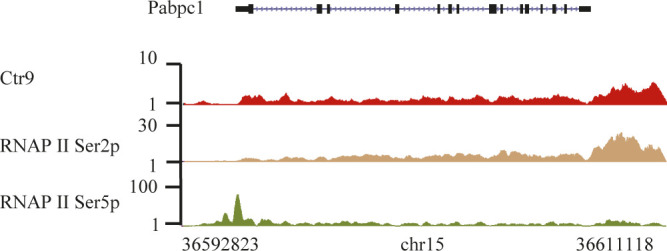
Representative genome browser tracks of ChIP-seq for Ctr9 (red), RNAPII Ser2p (brown), and RNAPII Ser5p (green) for a protein-coding gene in mES cells. Each ChIP-Seq experiment was performed with a single sample. The x-axis indicates the chromosome position, and the y-axis represents normalized read density in reads per million. The Pabpc1 gene is shown as an example.