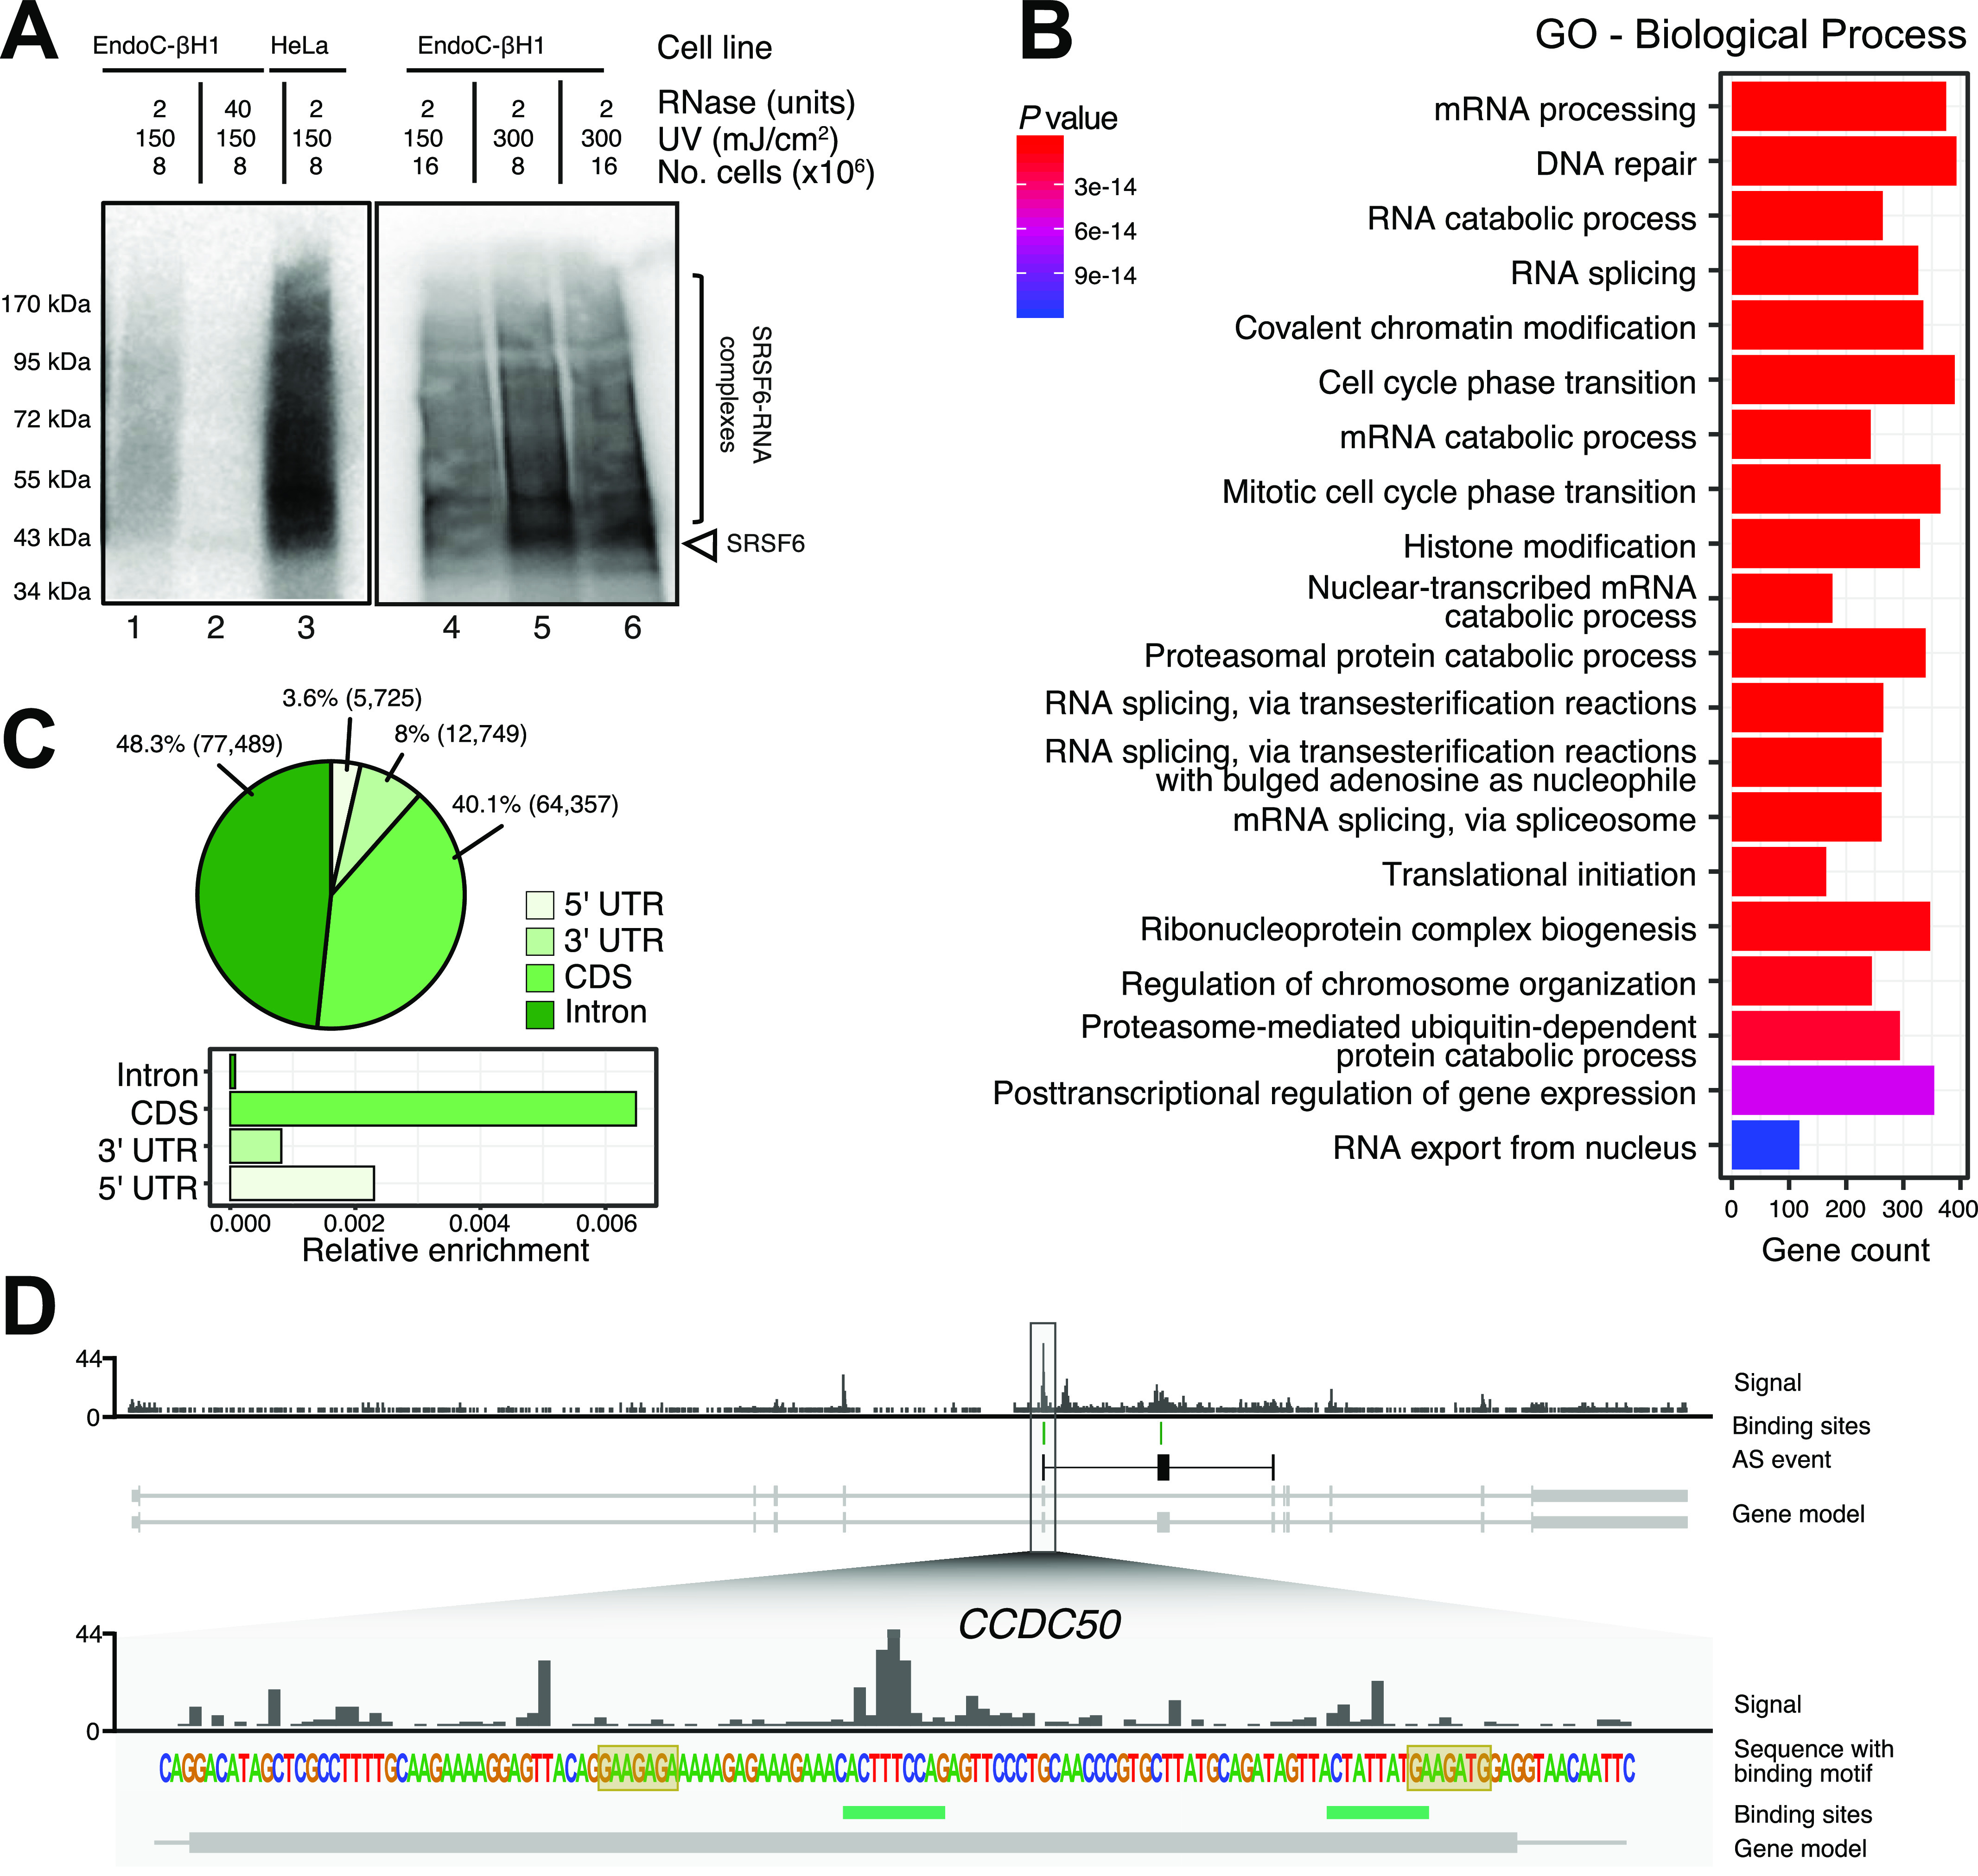
Figure 1. iCLIP experiments show SRSF6 binding to thousands of transcripts in EndoC-βH1 cells.
(A) Optimization of UV cross-linking conditions indicates that a combination of 300 mJ/cm2 UV energy and 8 × 10⁶ cells gives highest yield. Autoradiographs of 32P-labeled SRSF6–RNA complexes that immunoprecipitated from EndoC-βH1 (lanes 1, 2, 4–6) and HeLa cells (lane 3), separated by SDS–PAGE and immobilized on a nitrocellulose membrane. UV cross-linking was performed with different amounts of cells and using UV 254 nm with different irradiation energy, as indicated above. EndoC-βH1 cells were treated with low (2 U) and high (40 U) RNase concentration. High RNase concentration focuses the protein-RNA complexes to a defined band slightly above the expected molecular weight of SRSF6 (43 kD, arrowhead). (B) Gene Ontology enrichment in SRSF6-bound genes. Gene count refers to number of genes in the tested set that are associated with a given Gene Ontology term. P-value from hypergeometric distribution. (C) SRSF6 primarily binds coding sequences (CDS). The pie chart (top) shows distribution of SRSF6 binding sites per transcript region on protein-coding genes. Numbers indicate percentage or absolute number (brackets) of SRSF6 binding sites. The bar chart (bottom) shows relative enrichment per region, that is, number of binding sites normalized by summed length of respective bound transcript regions. (D) SRSF6 preferentially binds on exons of the CCDC50 gene. Genome browser view of SRSF6 iCLIP data (signal of merged replicates), binding sites (green), and SRSF6 motif (yellow boxes). Selected transcript isoforms are shown below (GENCODE v29), with black boxes highlighting a SRSF6-regulated alternative exon together with the flanking constitutive exons. UTR, untranslated region.
Source data are available for this figure.

