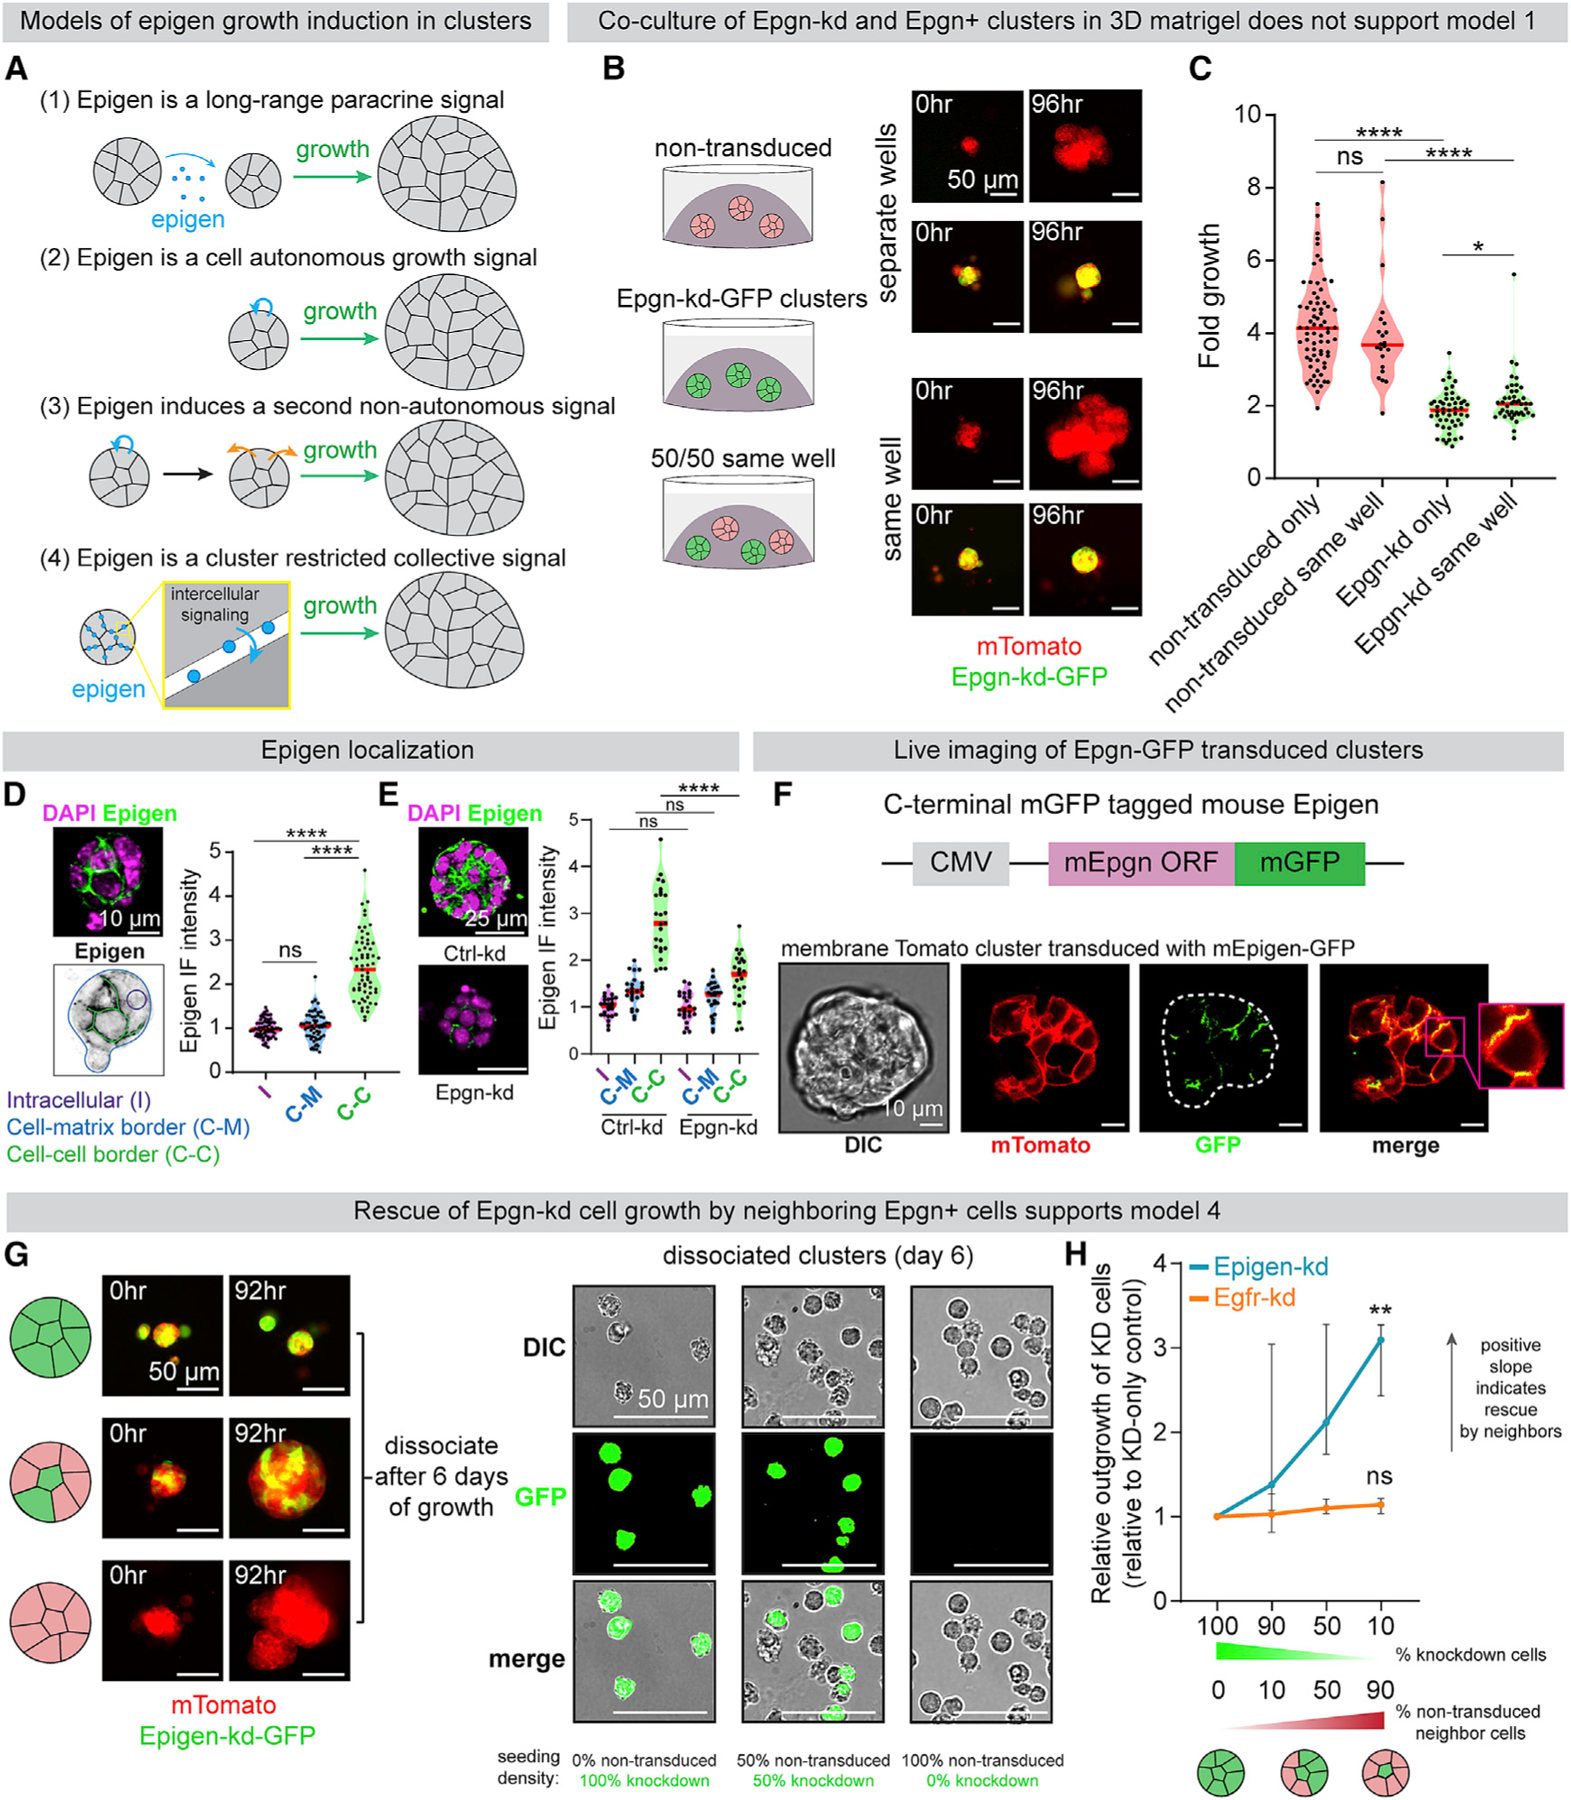
Figure 3. Epigen Acts as a Collective Signaling Factor Shared Non-cell-Autonomously within Clusters.

(A) Possible mechanisms by which epigen is a signal for cluster outgrowth.
(B) Epgn-kd and non-transduced clusters were cultured individually or co-cultured in the same 3D gel. Right: time lapse images of each condition.
(C) Time-lapse fold outgrowth measurements of (B). n = 71 non-transduced clusters alone, 22 in co-culture. n = 51 Epgn-kd clusters alone, 44 in co-culture. n = 2 biological replicates. p values = Mann-Whitney test.
(D) Immunofluorescence of epigen in a MMTV-PyMT cluster ex vivo. Bottom: schematic of IF quantification. Right: quantification of epigen signal. n = 3 biological replicates, n = 63 clusters. p values = Mann-Whitney tests.
(E) Immunofluorescence of epigen in Ctrl-kd and Epgn-kd clusters. Right: quantification of mean intensity in different regions. n = 2 biological replicates, 30 clusters per condition. p values = Mann-Whitney test.
(F) Live imaging of a mTomato PyMT cluster expressing epigen-mGFP.
(G) Left: time-lapse images of Epgn-kd-GFP and non-transduced mTomato-PyMT cells aggregated at different ratios to form pure or mosaic clusters. Right: dissociated cells after 6 days of culture.
(H) Relative outgrowth of Epgn-kd or Egfr-kd cells when mixed with different proportions of non-transduced cells. Epgn-kd n = 3 biological replicates (36,022 cells). Egfr-kd n = 4 biological replicates (19,911 cells). Median and 95% CI. p values = unpaired t tests versus 100% knockdown clusters.
See also Figure S4.
