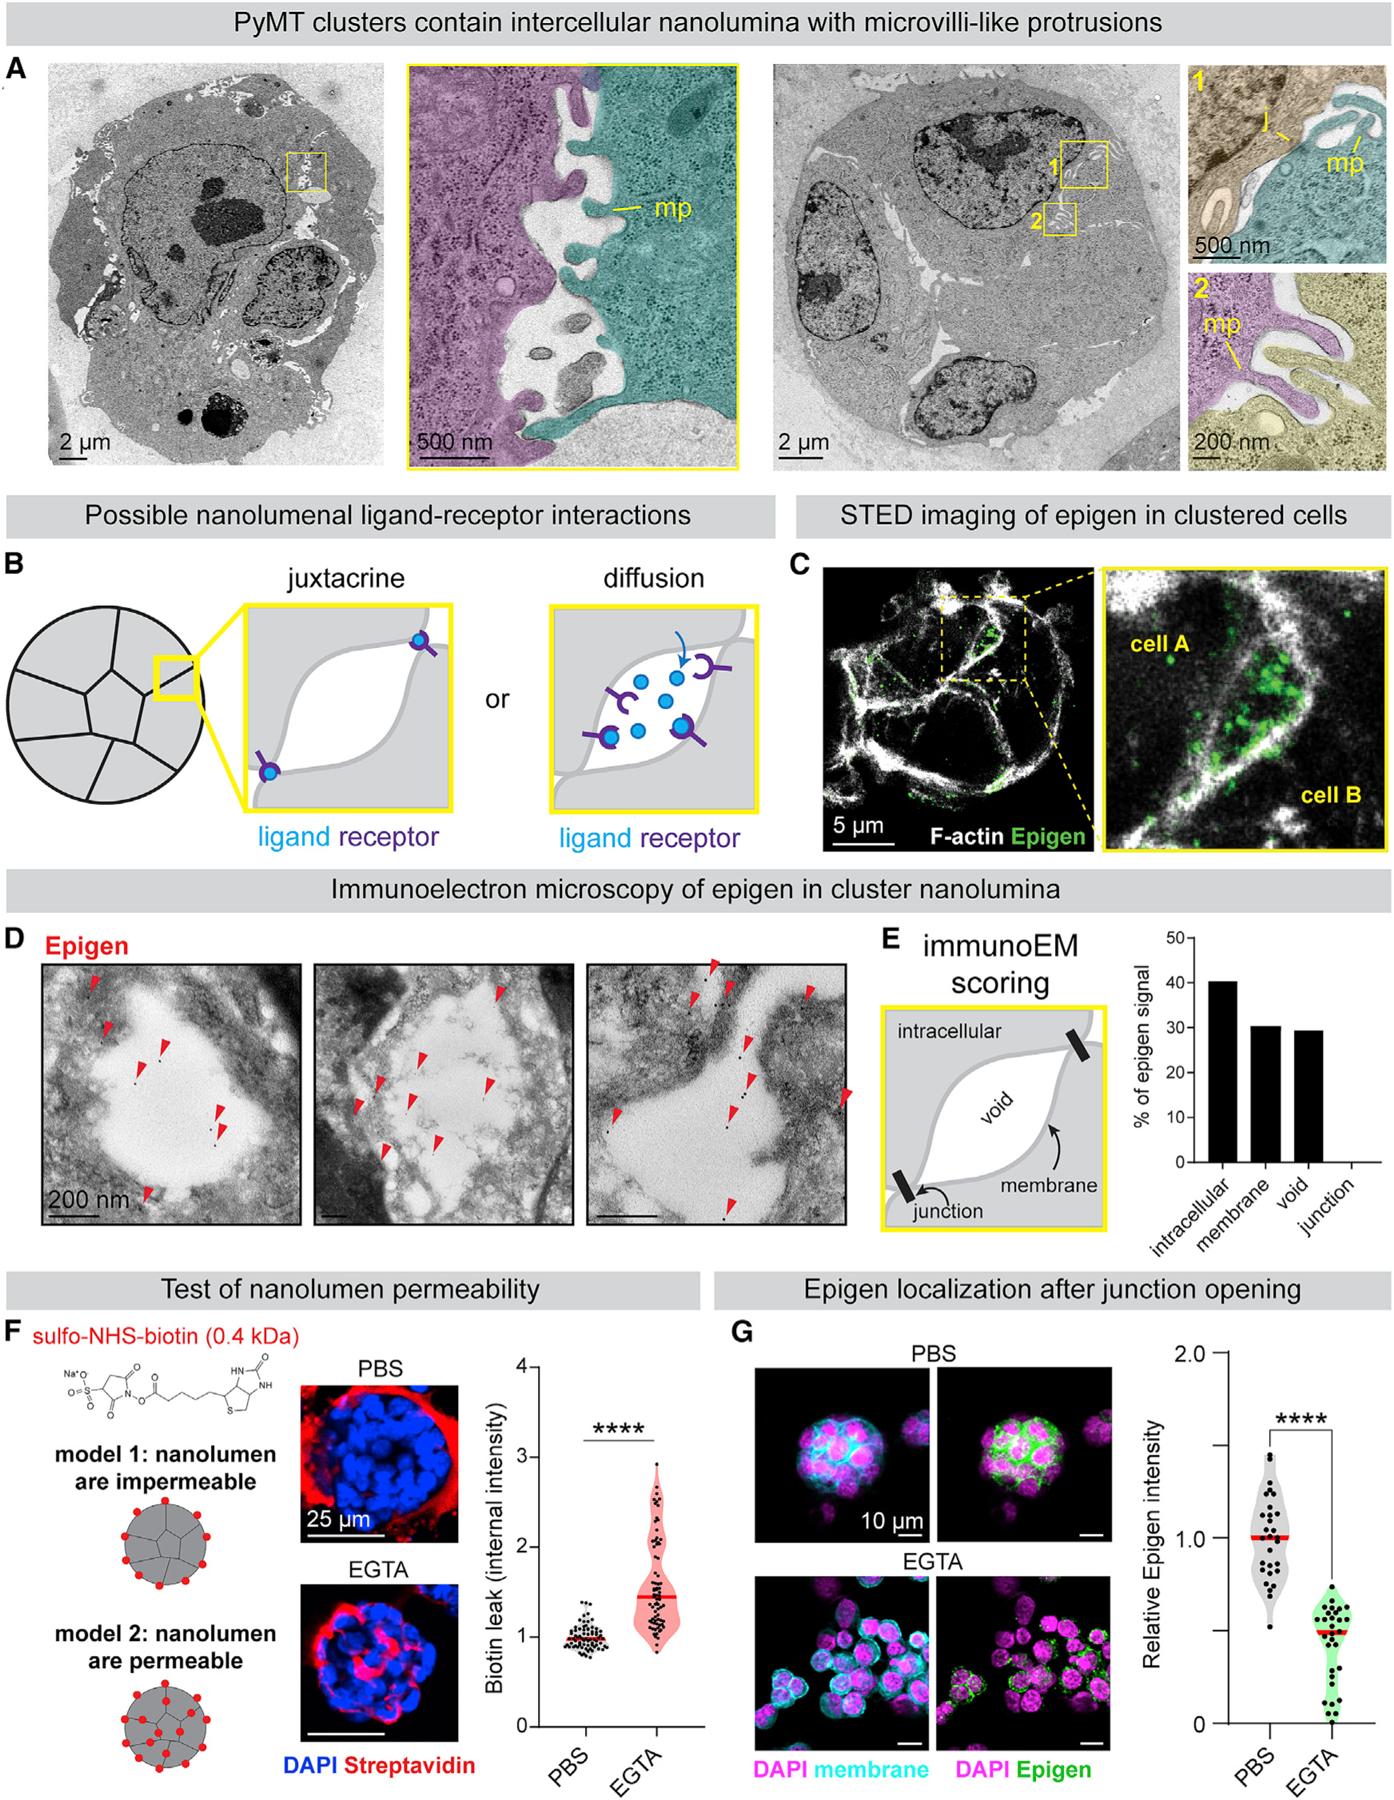
Figure 4. Epigen Is Stored and Concentrated within Intercellular Nanolumina.

(A) TEM images of MMTV-PyMT clusters (pseudo-colored). MP, microvilli-like protrusions; J, cell-cell junction.
(B) Models of intercellular epigen signaling as a membrane-restricted juxtacrine ligand or a diffusible paracrine ligand.
(C) Epigen immunofluorescence stimulated emission depletion microscopy images in a MMTV-PyMT cluster.
(D) Immunogold labeling of epigen in MMTV-PyMT clusters. Arrows, gold labeling.
(E) Schematic of features scored for Immunogold signal. Right: quantification of epigen Immunogold signal. n = 268 gold particles.
(F) To assess junctional permeability, clusters were incubated with sulfo-NHS-biotin. EGTA was used as a positive control to disrupt cell-cell junctions. Right: quantification of streptavidin-fluorescein isothiocyanate (FITC) fluorescence. n = 3 biological replicates. n = 75 clusters per condition. p values = Mann-Whitney tests.
(G) Immunofluorescence of epigen in clusters ± 1 mM EGTA treatment. Right: median epigen intensity per cluster. n = 3 biological replicates, 59 clusters. p value = Mann-Whitney test.
See also Figures S4 and S5.
