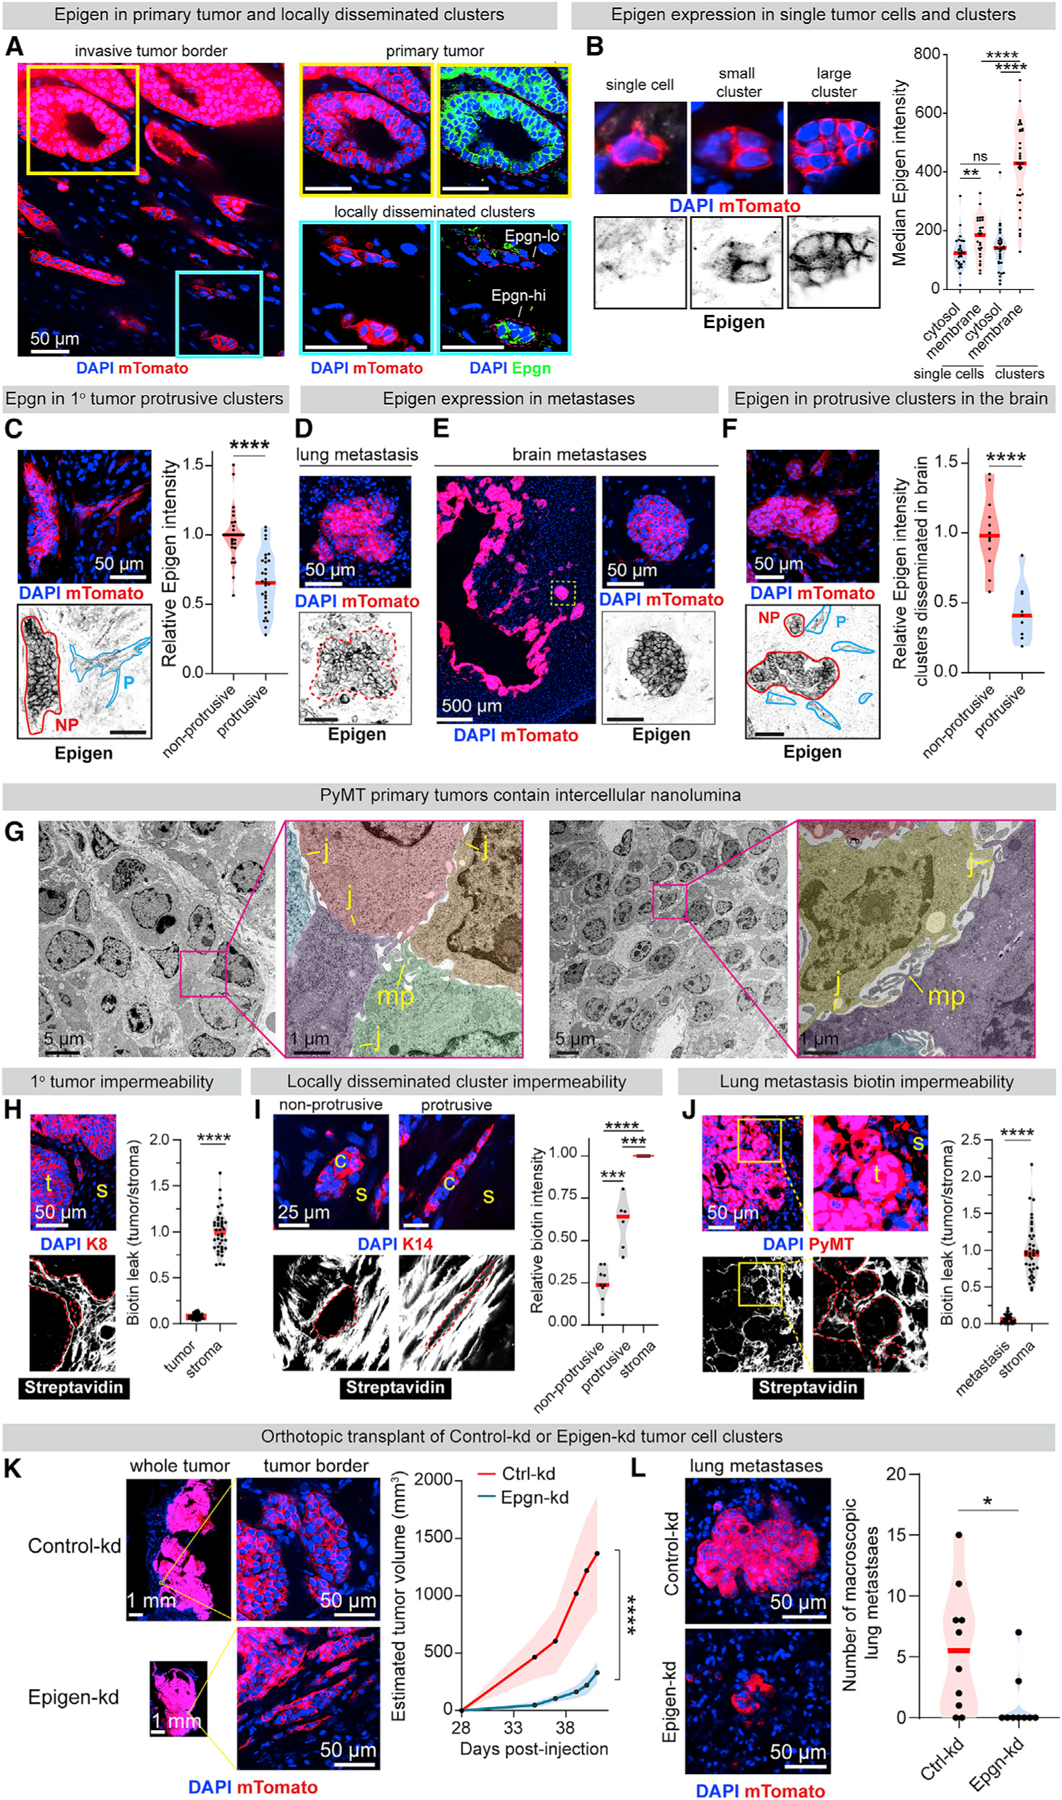
Figure 5. Epigen Suppression Reduces Both Primary and Metastatic Tumor Outgrowth.

(A) Immunofluorescence of epigen in a mTomato-PyMT primary tumor and adjacent clusters 10 weeks after orthotopic transplant in non-fluorescent NSG mouse.
(B) Quantification of epigen expression in locally disseminated single tumor cells and non-protrusive tumor cell clusters. n = 27 single cells, 33 clusters. n = 2 tumors. p values = Mann-Whitney tests.
(C) Immunofluorescence of epigen in locally disseminated clusters adjacent to a primary tumor. NP, non-protrusive; p, protrusive. Right: relative epigen intensity. n = 3 tumors. n = 29 non-protrusive, 31 protrusive clusters (clusters with intermediate morphology were not scored). p value = Mann-Whitney test.
(D) Epigen immunofluorescence of a spontaneous lung metastasis 10 weeks after mTomato-PyMT organoid orthotopic transplant.
(E) Epigen immunofluorescence in brain metastases 6 weeks after mTomato-PyMT cluster intracardiac injection.
(F) Epigen immunofluorescence in the brain 6 weeks after intracardiac mTomato-PyMT cluster injection. n = 3 mice. n = 12 non-protrusive, 9 protrusive clusters. p value = Mann-Whitney test.
(G) TEM of an MMTV-PyMT tumor. Pseudo-color highlights different cells. MP, microvilli-like protrusions; J, cell-cell junctions.
(H) Immunofluorescence of Keratin-8 (K8) and FITC-streptavidin in MMTV-PyMT primary tumors treated with sulfo-NHS-biotin. Right, FITC-streptavidin quantification. n = 3 tumors, 50 tumor areas (“t”), 50 stromal (“s”) areas. p value = Mann-Whitney test.
(I) Immunofluorescence of Keratin-14 and FITC-streptavidin in locally disseminated clusters from tumors fixed after sulfo-NHS-biotin treatment. Right: for each cluster, internal FITC-streptavidin signal relative to adjacent stroma. n = 15 clusters (9 non-protrusive, 6 protrusive), n = 2 tumors. p values = Mann-Whitney tests.
(J) Immunofluorescence of PyMT and FITC-streptavidin in mouse lungs 2 weeks after tail vein injection of MMTV-PyMT clusters, lungs treated with sulfo-NHS-biotin before fixation. Right: FITC-streptavidin quantification. n = 3 mice, 50 metastasis areas (“t”), 32 stromal areas (“s”). p value = Mann-Whitney test.
(K) Primary tumors 6 weeks after orthotopic transplant of Ctrl-kd or Epgn-kd PyMT clusters. Right: estimated tumor volume. n = 10 Ctrl-kd mice, 9 Epgn-kd mice. p value = Mann-Whitney test.
(L) Left: lung metastases 6 weeks after orthotopic transplant. Right: # of visible GFP+ lung macrometastases per mouse. n = 10 Ctrl-kd mice, 9 Epgn-kd mice. p value = Mann-Whitney test.
See also Figure S6.
