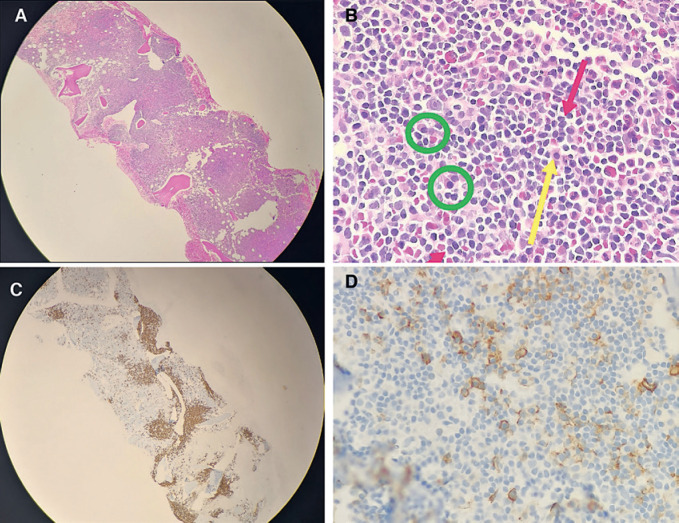
Fig. 1.
Bone marrow trephine biopsy. A Bone marrow trephine at ×4 magnification, showing hypercellular bone marrow and hyperchromatic areas of nodular and paratrabecular infiltrates. B Bone marrow trephine at ×50 magnification. The hyperchromatic areas comprise small lymphoid cells with mature appearance (red arrows), admixed plasma cells (green circles) and associated mast cells (yellow arrow). C Bone marrow trephine immunohistochemistry. CD20 highlights the B-lineage infiltrate with the paratrabecular and nodular infiltrate comprising about 30% of the marrow surface area. D Bone marrow trephine Immunohistochemistry. CD138 staining highlights the admixed plasma cells.

