
Figure 2. Schizophrenia PRS Effect Sizes Across 6 domains.
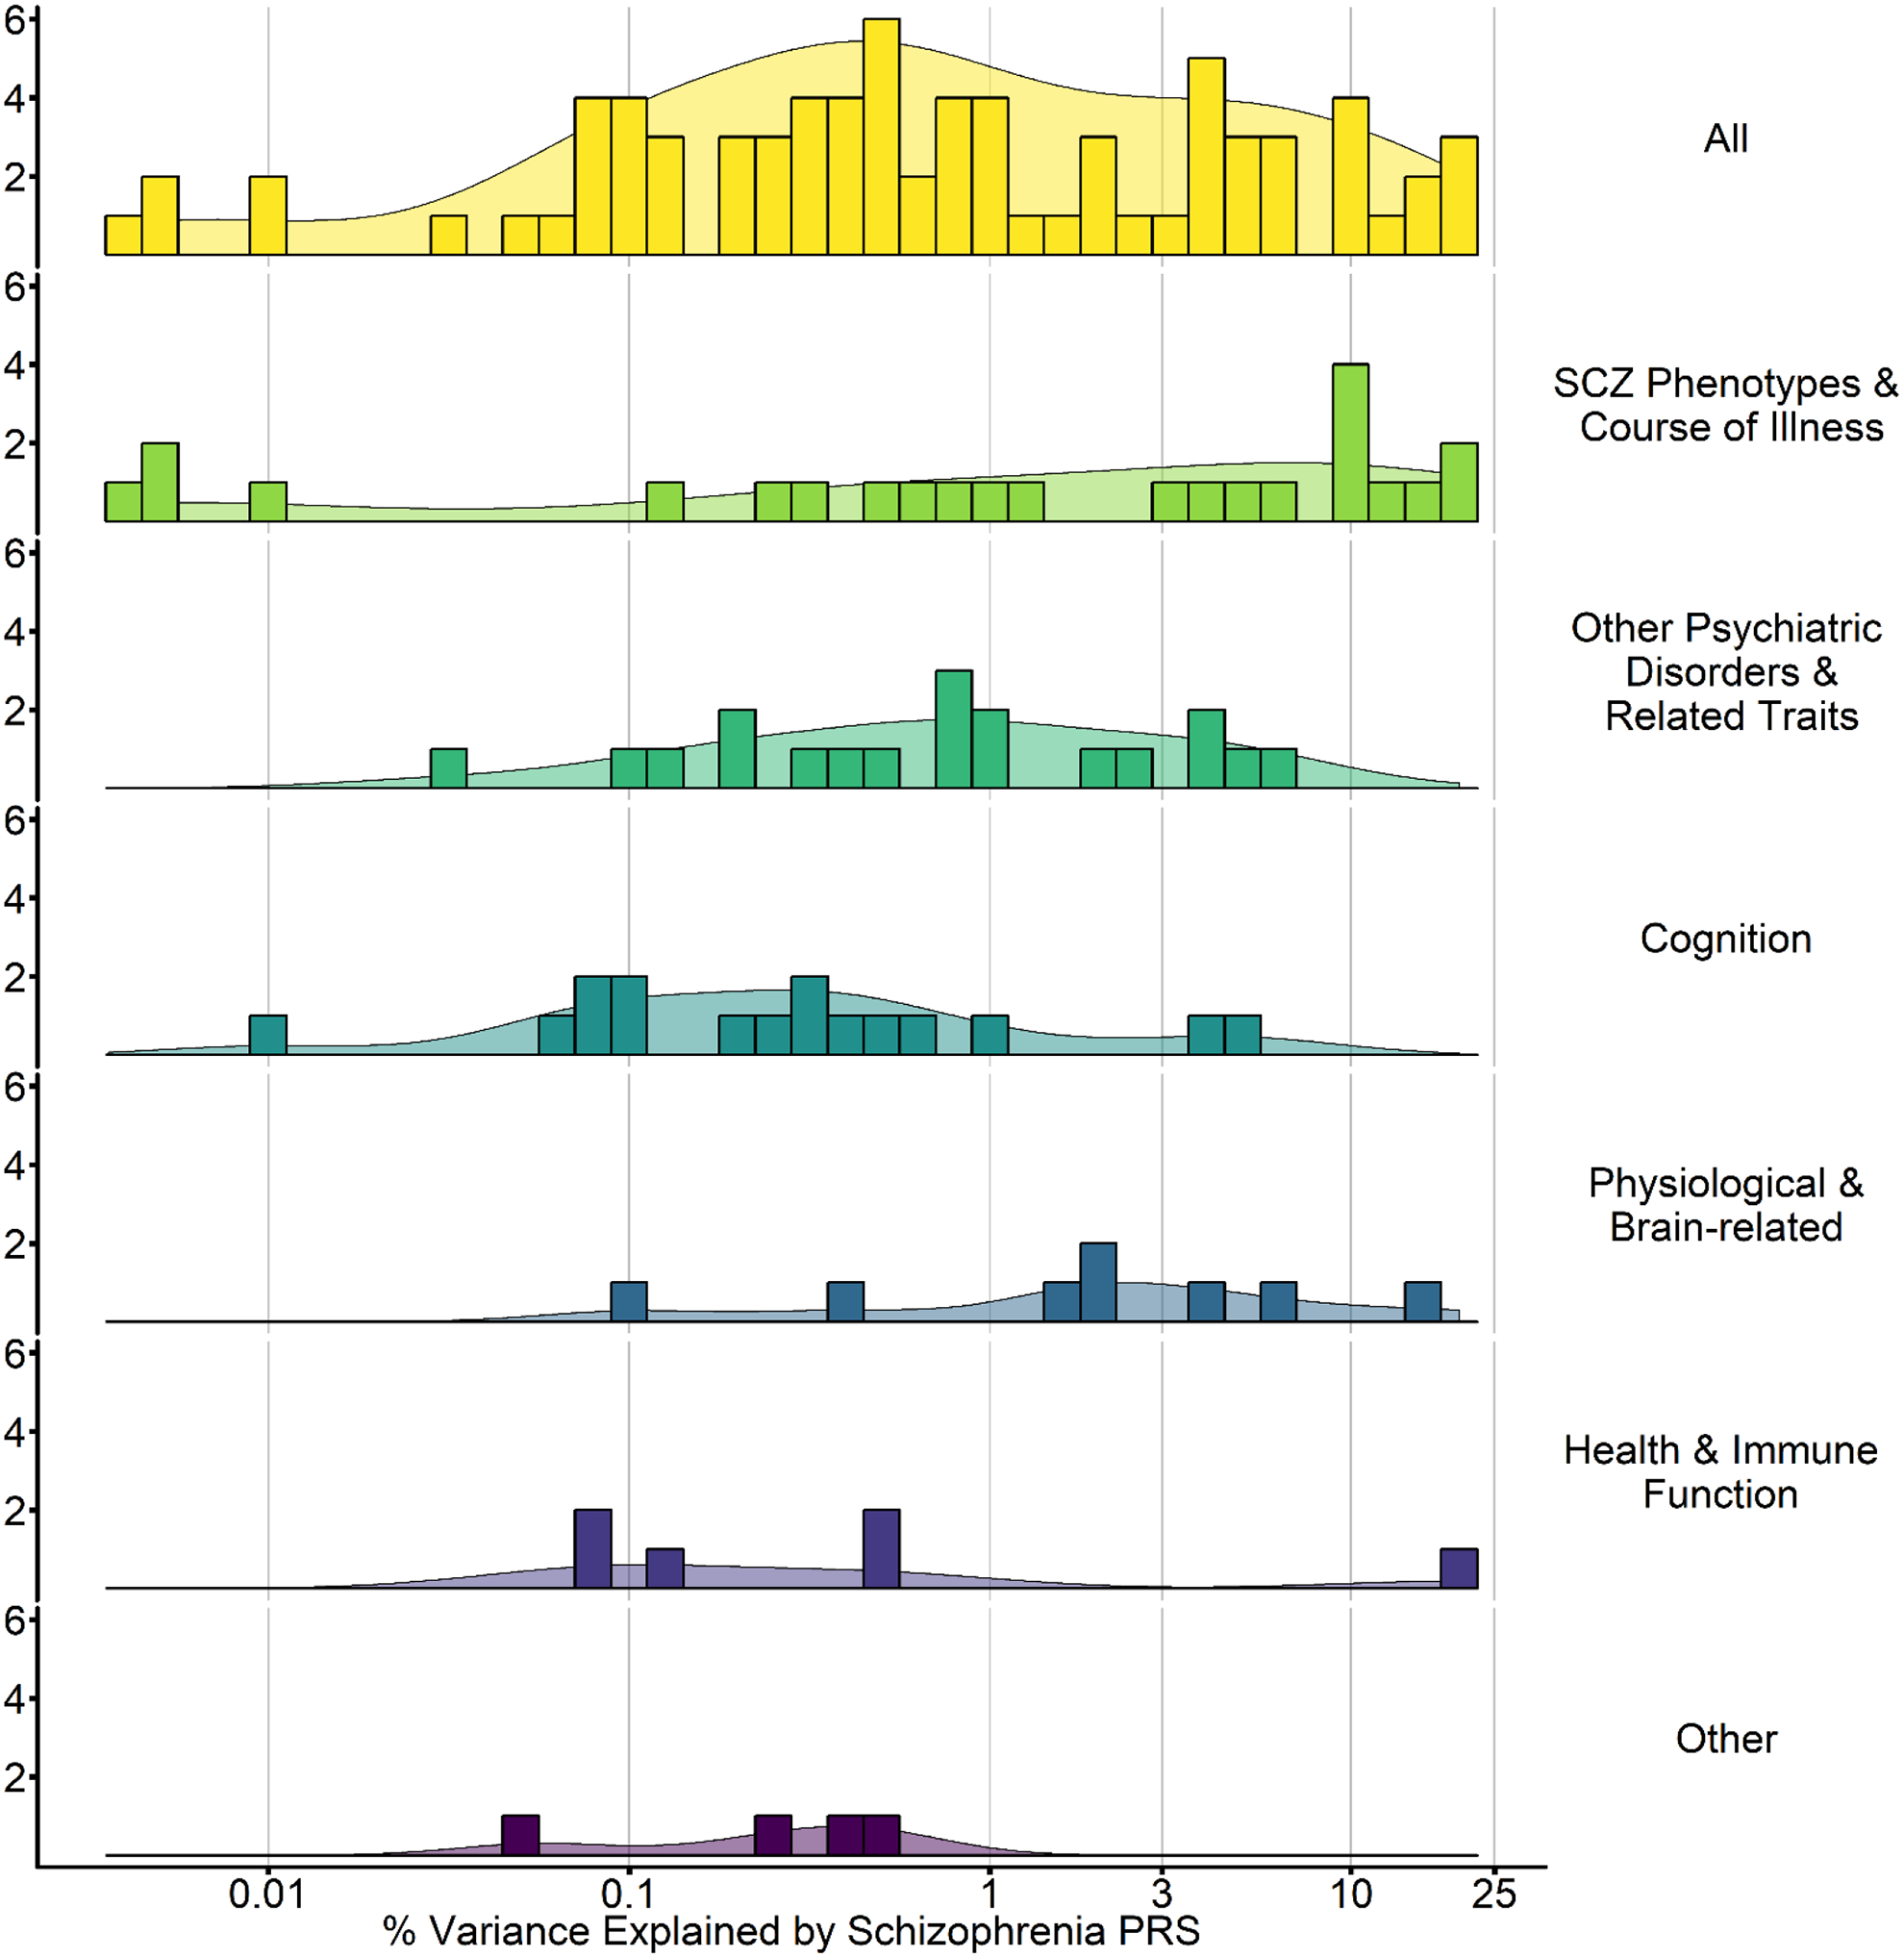
Plotted here is the range of the maximal percentage of variance explained by PGC SCZ2 PRS (Schizophrenia Working Group of the Psychiatric Genomics, 2014) in each study. Studies using other summary statistics are not included. Notably, as these are the maximal amount of variance explained and many studies reporting null effects did not report effect sizes, these estimates should be viewed as optimistic. The percentage of variance explained by Schizophrenia PRS in related traits ranges from 0.001 to 40% with 0.5–1.0% being most common. All = all identified Schizophrenia PRS studies. Course of illness = studies assessing course of illness. Psychiatric disorders and traits = studies evaluating other psychaitic disorders (e.g., bipolar disorder) or traits (e.g., neuroticism). Cognition = cognitive phenotypes (e.g., working memory). Brain-related = imaging phenotypes (e.g., cortical thickness), Health and immune function = immune (CRP levels) and reported health (e.g., physical health). Other = various other phenotypes related to schizophrenia (e.g., urbanicity). Individual studies contributing to this are summarized and * in Tables 1–6.