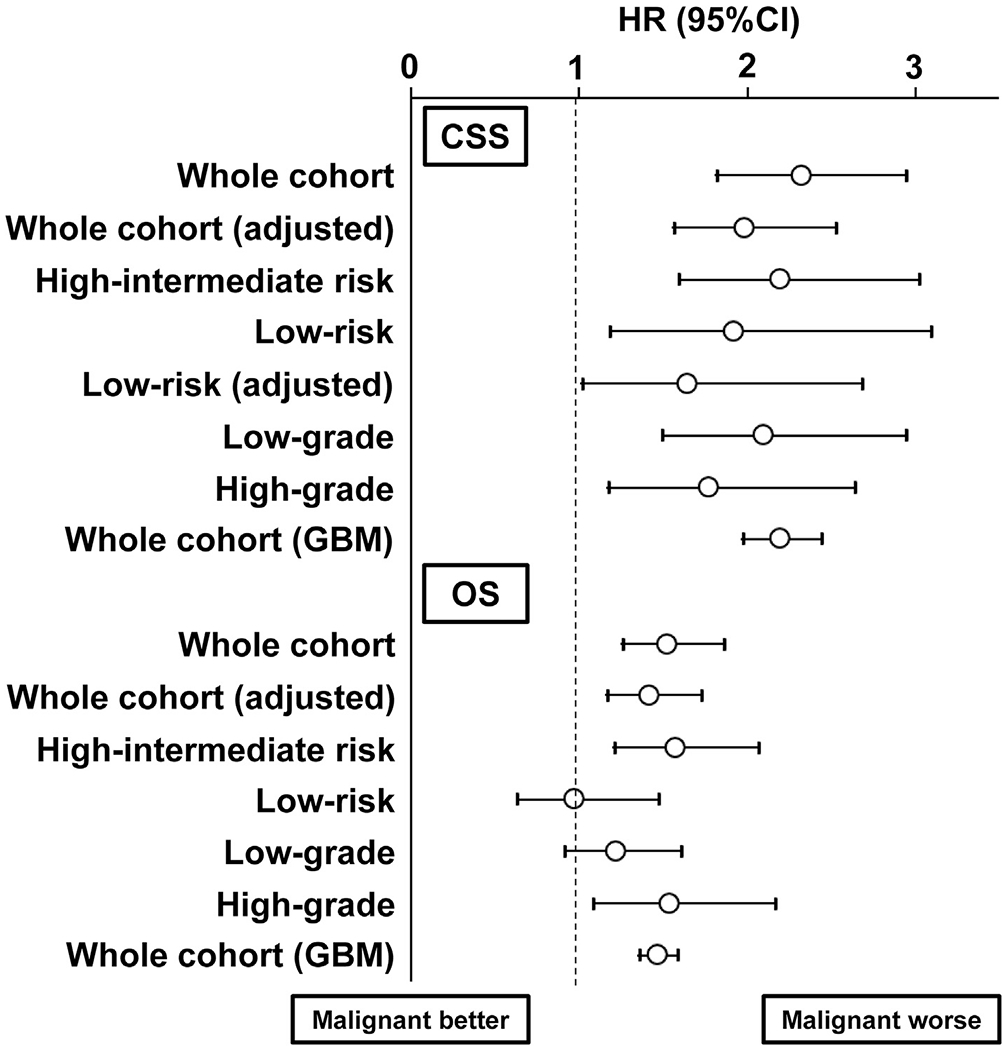
Fig. 3. Forest plots for outcome measures.

An association of peritoneal cytology (malignant versus negative) and survival outcome was assessed with Cox proportional hazard regression in the PS-IPTW models. The adjusted model indicates that the association of malignant peritoneal cytology and survival outcome was adjusted for the covariates exhibiting size effect in weighted model. Circles represent HR, and bars represent 95% CI. HR, hazard ratio; CI, confidence interval; WPRT, whole pelvic radiotherapy; GBM, generalized boosted model; CSS, cause-specific survival; OS, overall survival.
