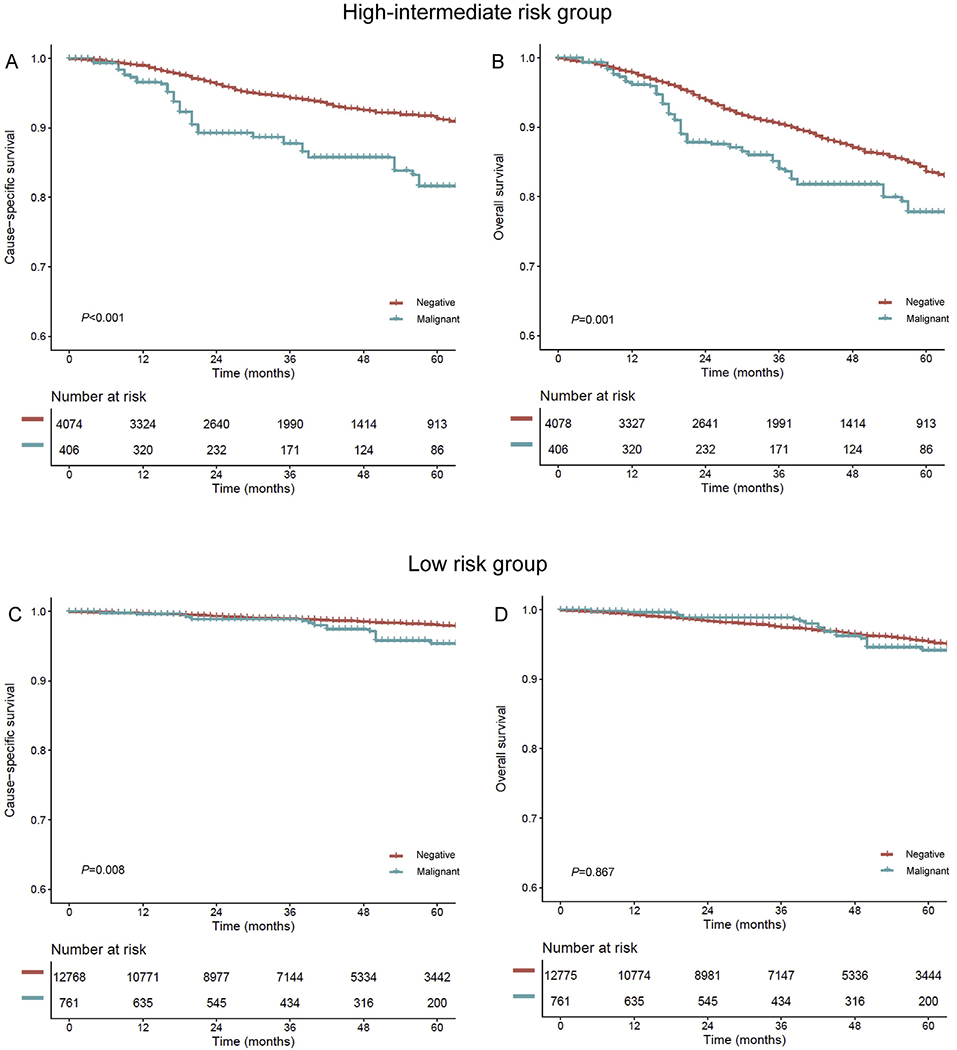
Fig. 4. The survival curve estimates based on peritoneal cytology results (high–intermediate-risk and low-risk groups).

Survival curves based on peritoneal cytology status (malignant versus negative) are shown for (A) CSS and (B) OS in the high–intermediate-risk group and (C) CSS and (D) OS in the low-risk group. Y-axis is truncated to 0.6–1.0. Negative, no malignant cells in peritoneal cytology; malignant, malignant cells in peritoneal cytology; CSS, cause-specific survival; OS, overall survival.
