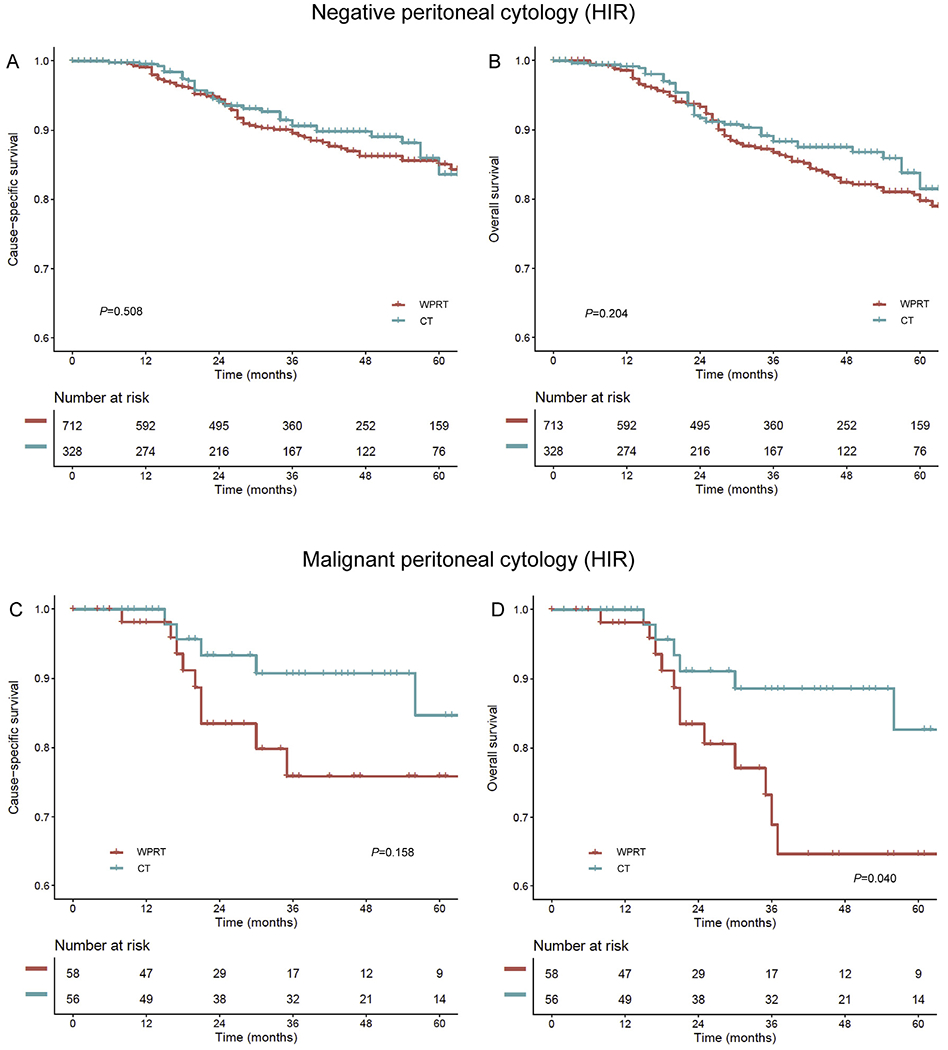
Fig. 5. The survival curve estimates based on postoperative therapy (high–intermediate-risk cohort).

Survival curves based on postoperative therapy status (chemotherapy versus whole pelvic radiotherapy) are shown for (A) CSS and (B) OS in the negative cytology group and (C) CSS and (D) OS in the malignant cytology group. Malignant peritoneal cytology cases were examined in the unweighted model because of limited sample size and event number. All measured factors were balanced in negative cytology cases (all SD ≤ 0.2). Y-axis is truncated to 0.6–1.0. WPRT, whole pelvic radiotherapy; CT, chemotherapy; CSS, cause-specific survival; OS, overall survival.
