Figure 5.
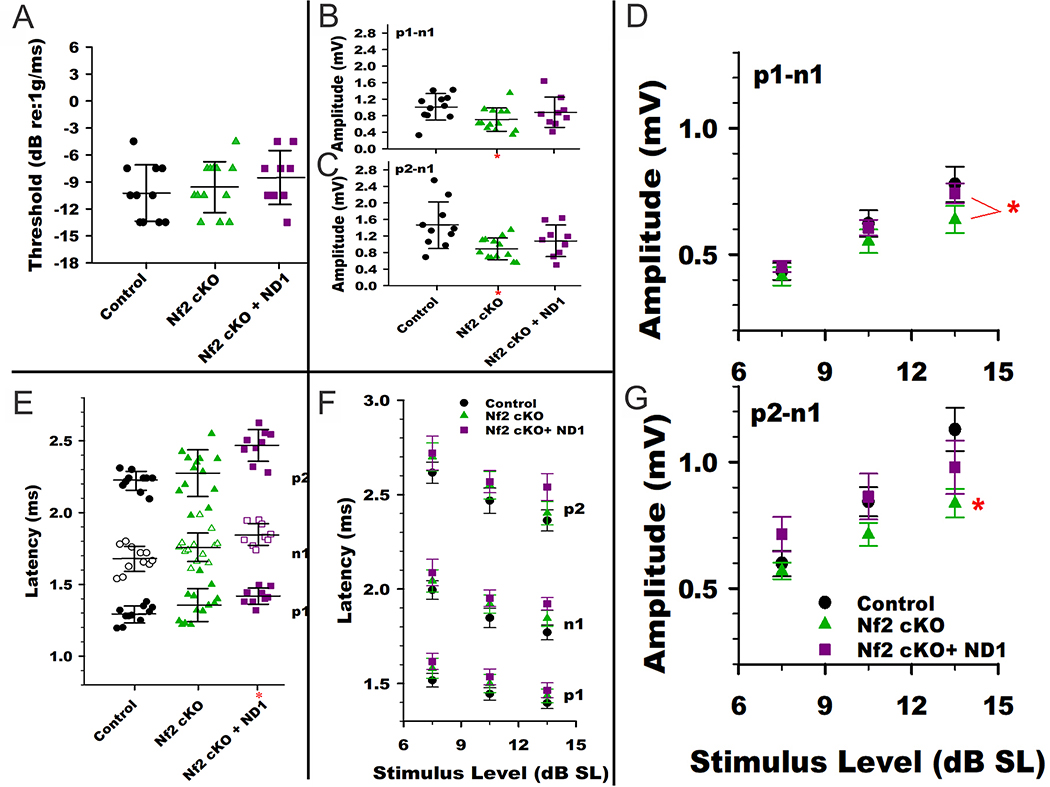
VsEP responses for the three genotypes. (A) VsEP threshold distributions among the different genotypes. There were no significant differences in mean threshold across groups. (B) VsEP Latencies at +6dB re:1g/ms. Latency distributions across animals are plotted for the three genotypes. Latencies (p1, n1 & p2) on average for the KO+ND1 group were prolonged relative to the control group (MANOVA post hoc Bonf. p1: p = 0.015, n1: p = 0.002, p2: p = 0.001). Dashed red line reflect the mean latencies for the control group. (C,D) VsEP Amplitudes at a stimulus level of +6 dB re:1g/ms. Mean amplitude for KO animals (*) were reduced compared to the control group (MANOVA post hoc Bonf: p1-n1: p = 0.015; p2-n1: p = 0.007). Mean amplitude for the KO+ND1 group was not significantly different than controls. (E) Normalized VsEP latencies. With stimulus levels expressed in sensation level (i.e., dB above threshold, dB SL) latency differences between Nf2 cKO+ND1 and control groups were reduced such that there were no significant differences found. This indicates that changes in vestibular sensitivity contributed to the differences in latencies seen at +6 dB re:1g/ms. f,g) Normalized VsEP amplitudes. Stimulus level is represented as dB above threshold (dB SL). Amplitudes for the Nf2 cKO group (*) remained below those of the control and Nf2 cKO+ND1 animals for p2-n1 at the highest stimulus level (MANOVA post hoc Bonf p2-n1 at 13 dB SL: p = 0.032). p1-n1 amplitudes at the highest stimulus level were different between the Nf2 cKO and Nf2 cKO+ND1 groups (MANOVA, post hoc Bonf., p = 0.04). See Supplemental Tables 1 and 2 for details.

