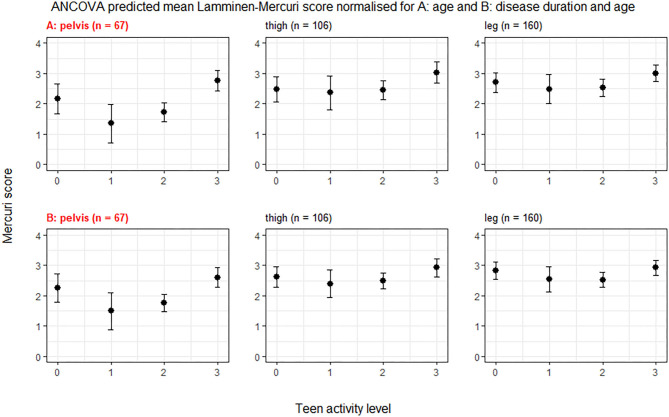
Figure 1.
ANCOVA predicted Lamminen-Mercuri scores for each exercise group. The top row (A) shows predicted score in each exercise group (0, 1, 2, or 3) adjusted for age—i.e., as though all patients were the cohort mean age of 39 years. The bottom row (B) shows predicted score in each exercise group (0, 1, 2, or 3) adjusted for disease duration and age—i.e., as though all patients had an age of 39 years and the cohort mean symptom duration of 17 years. Bars show the 95% confidence interval. Red text denotes groups showing significant differences on ANCOVA (p < 0.005).

