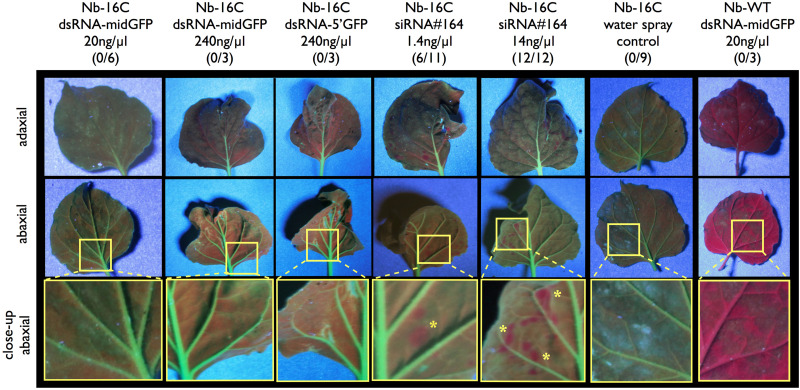
FIGURE 1.
UV-light monitoring of GFP expression after dsRNA and siRNA spraying. Nb-16C plants were sprayed with 20 ng/μl dsRNA-midGFP, 240 ng/μl dsRNA-midGFP, 240 ng/μl dsRNA-GFP5′, 1.4 ng/μl siRNA#164, 14 ng/μl siRNA#164, water only and Nb-WT plants were sprayed with 20 ng/μl dsRNA-midGFP. One to four leaves per plant were sprayed. The three rows show adaxial and abaxial sides of matching leaves, and close up views of abaxial sides, visualized under the UV light, respectively. The area shown in close-up view is shown in yellow rectangle in abaxial view. Nb-WT sample is completely red due to the chloroplasts and Nb-16C samples are green due to the presence of GFP. Only the positive control leaves sprayed with low and high concentration of siRNA#164 showed silencing spots, highlighted with yellow stars in the close-up view. The number of plants showing silencing over the total number of plants treated in given condition is given in parenthesis.

