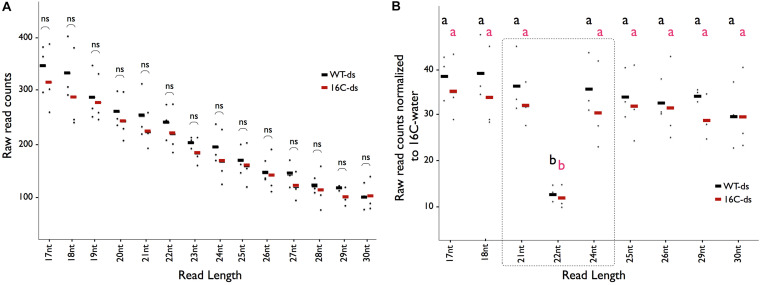
FIGURE 2.
Distribution of sRNAs matching the GFP sequence. (A) The average abundance of sRNA-seq reads mapping to the GFP sequence for the given read length (X-axis) in WT-ds (black), 16C-ds (red) lines. Each dot represents one biological replicate in the given condition. Student t-test shows that there is no significant (ns) enrichment of an sRNA in 16C-ds samples when compared to WT-ds samples. (B) The number of reads with specific length mapping to the GFP in 16C-ds (red) and WT-ds (black) samples normalized to 16C-water samples does not show any enrichment of a specific class of sRNA. One-Way ANOVA test shows that there is only depletion of 22nt-long siRNA but no enrichment of sRNAs associated with gene silencing (shown in the dotted square). All data are based on the evaluation of three biological replicates and each dot represents one data point. Significant differences (a and b) were calculated by one-way ANOVA, Bonferroni’s post test P < 0.05.

