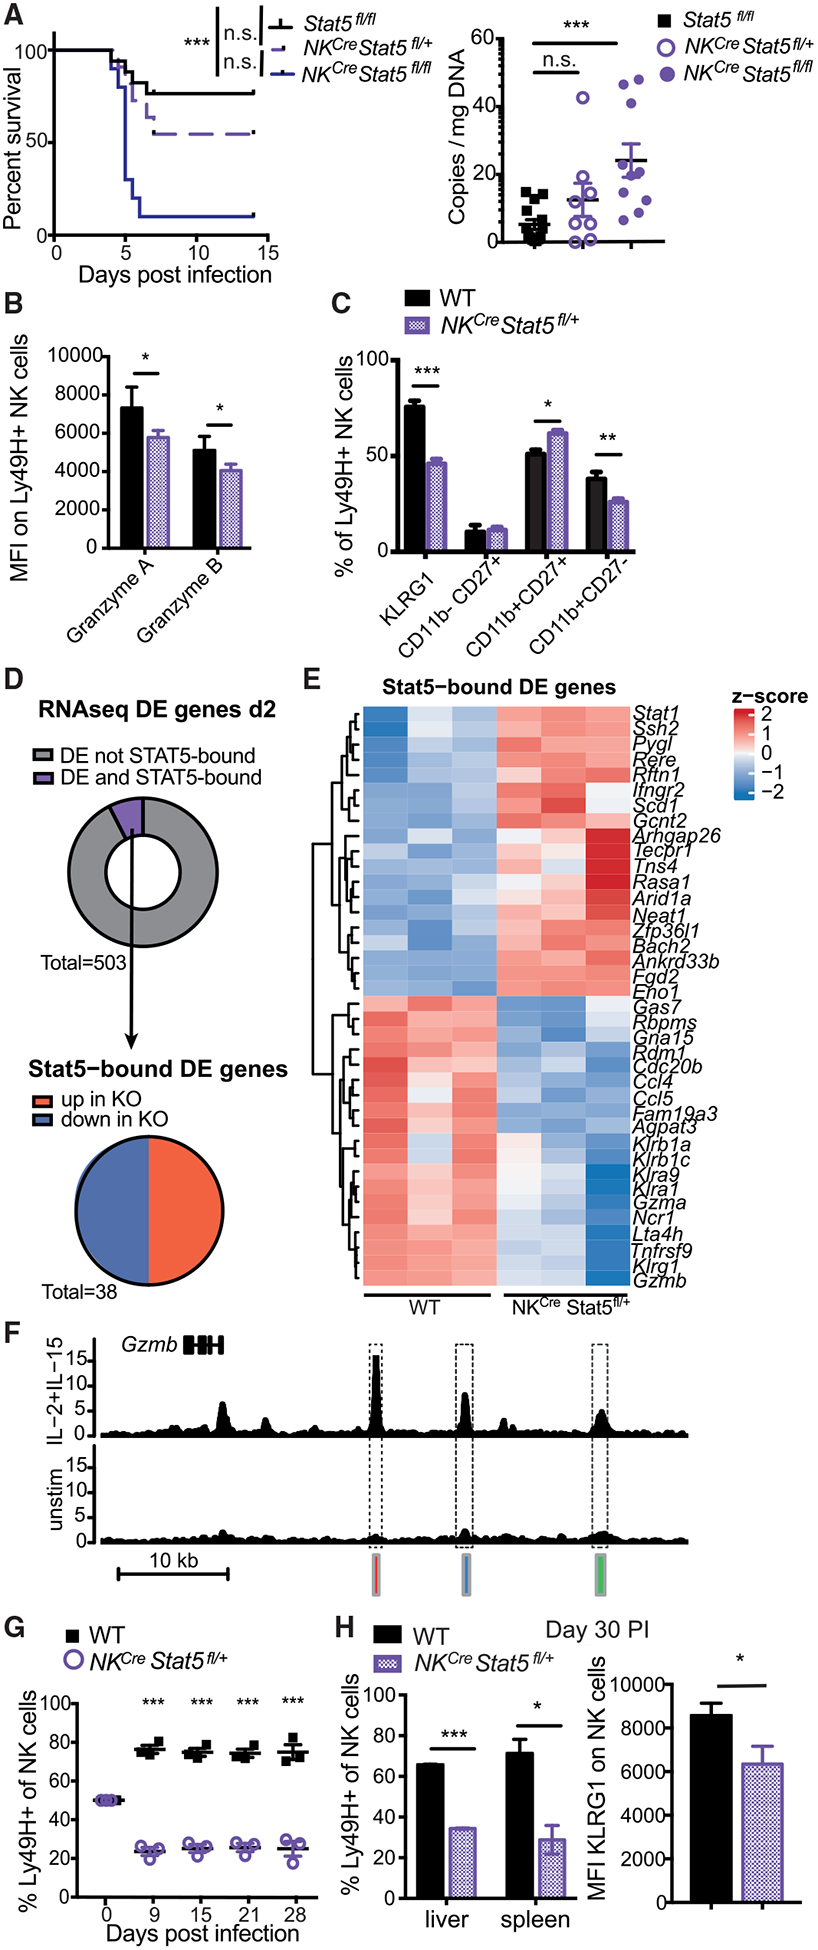
Figure 2. STAT5-Dependent Anti-viral NK Cell Response.

(A) Stat5fl/fl, NKCre × Stat5fl/+, and NKCre × Stat5fl/fl mice were infected with high-dose MCMV. Viral titers in the serum were measured on day 4 PI. Data are representative of 2 independent experiments (n = 4–6).
(B and C) Mixed WT:NKCre × Stat5fl/+ BMC mice were infected with MCMV. Ly49H+ WT or NKCre × Stat5fl/+ NK cells from spleen were analyzed on day 2 PI for granzyme A and B expression (B) or indicated activation/maturation markers (C). Data are representative of at least 2 independent experiments (n = 4).
(D) RNA-seq was performed on Ly49H+ WT or NKCre × Stat5fl/+ NK cells at day 2 PI (n = 3). ChIP-seq was performed on NK cells stimulated with IL-2 and IL-15 for 3 h. Donut graph displays the proportion of DE genes (adjusted p value [padj] < 0.05) that are STAT5 bound (purple). Pie graph displays STAT5-bound DE genes (padj < 0.05) categorized by direction of gene expression.
(E) Heatmap shows Z scores of all DE and STAT5-bound genes described in (D).
(F) Representative gene tracks of mapped STAT5 ChIP.
(G and H) Splenocytes from mixed WT:NKCre × Stat5fl/+ BMC mice were adoptively transferred into Rag2−/− × Ly49h−/− mice and infected with MCMV. (G) Graph shows the relative WT to NKCre × Stat5fl/+ NK cell percentages that were measured over the course of infection. (H) Bar graphs show percentage of memory Ly49H+ WT and NKCre × Stat5fl/+ NK cells in spleen and liver and KLRG1 surface expression (liver) on day 30 PI. Data are representative of 2 independent experiments (n = 3–4).
All error bars indicate SEM.
