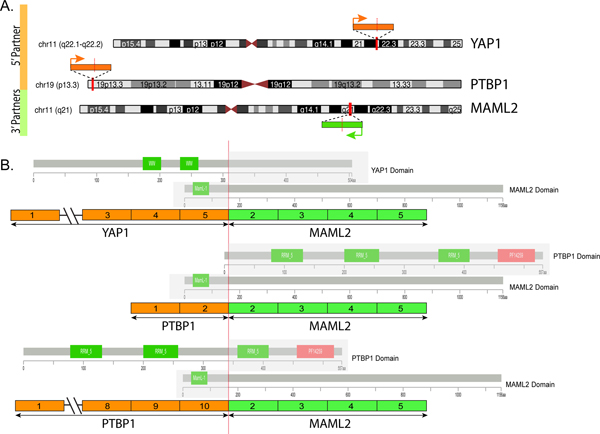
Figure 2. Diagrammatic representation of the YAP1-MAML2 and PTBP1-MAML2 fusions.
(A) Chromosomal location of YAP1 gene locus in 11q22.1-q22.2, PTBP1 in 19p13.3 and MAML2 in 11q21; red vertical lines depict the genomic breakpoint locus. Arrows show the direction of transcription of each gene. (B) Upper panel depicts the YAP1-MAML2 transcript, composed of the first 5 exons of YAP1 fused to most of MAML2 (exons 2-5). Middle and lower panels show the two transcript isoforms of PTBP1-MAML2, composed of either the first 2 exons or the first 10 exons of PTBP1 gene fused to MAML2 gene exons 2-5. The protein domains of each of the genes involved are also schematically depicted.

