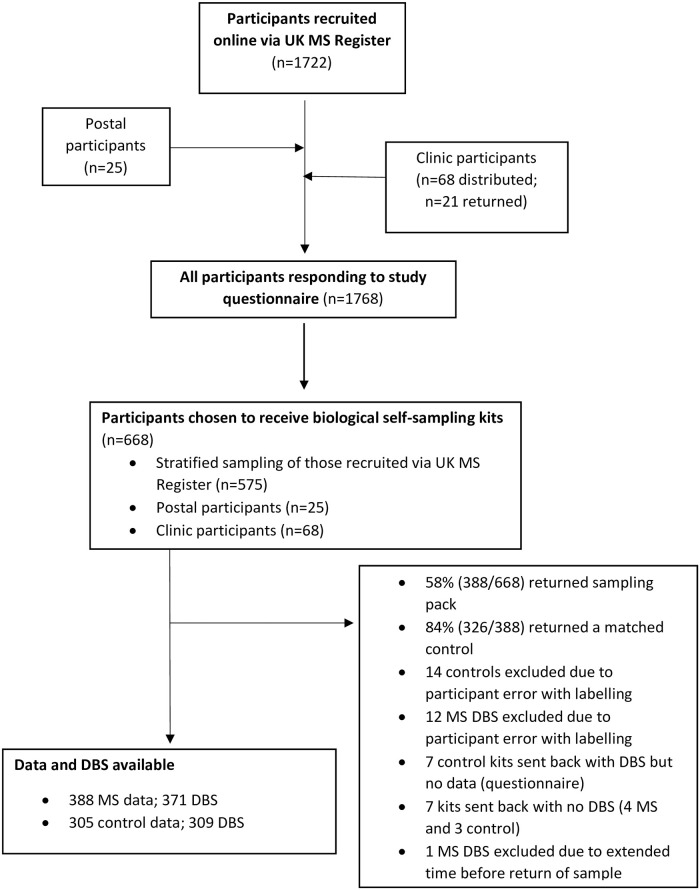
Fig 1. Flow chart of the study recruitment and resulting study population.
388 MS participants and 309 matched controls returned sampling kits. In some cases, data or biological material was not available for all data points, resulting in 388 MS with data and 371 MS with DBS and 305 controls with data and 309 controls with DBS.

