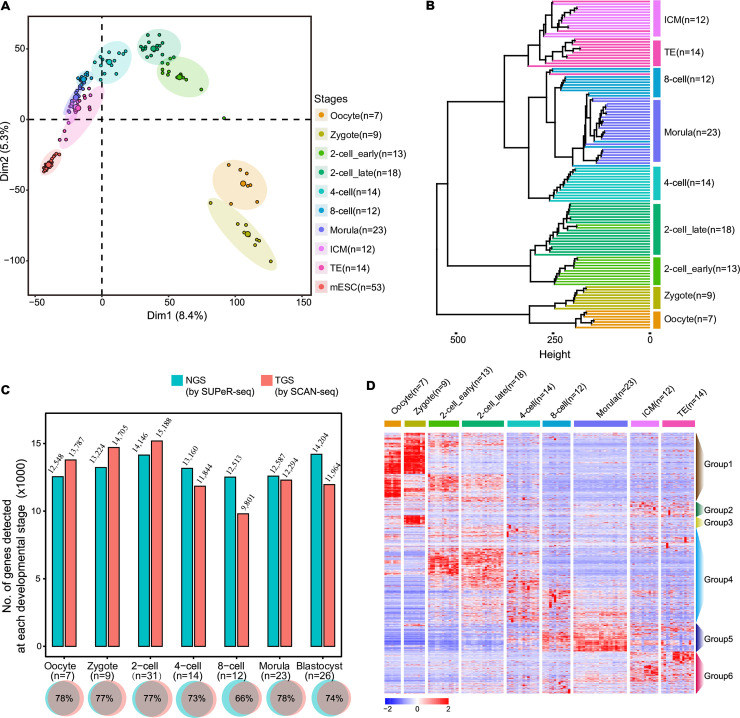
Fig 3. Transcriptome analysis in mouse preimplantation embryos.
(A) PCA of mESCs and all blastomeres at different developmental stages. (B) Hierarchical clustering of all blastomeres at different developmental stages. Cells of the same stage clustered together and the adjacent stage showed shorter distances. (C) Comparison between the number of genes detected at each developmental stage by NGS and TGS. SCAN-seq detected more genes before 4-cell stage. And 66% to 78% genes were overlapped by these 2 methods at the same stage. (D) Heatmap of gene expressions showing developmental stage-specific patterns. A total of 2,252 genes were divided into 6 groups according to their expression patterns. (A, C, D) The numerical data are listed in S1 Data. ICM, inner cell mass; mESC, mouse embryonic stem cell; NGS, next generation sequencing; PCA, principal component analysis; TE, trophectoderm; TGS, third-generation sequencing.

