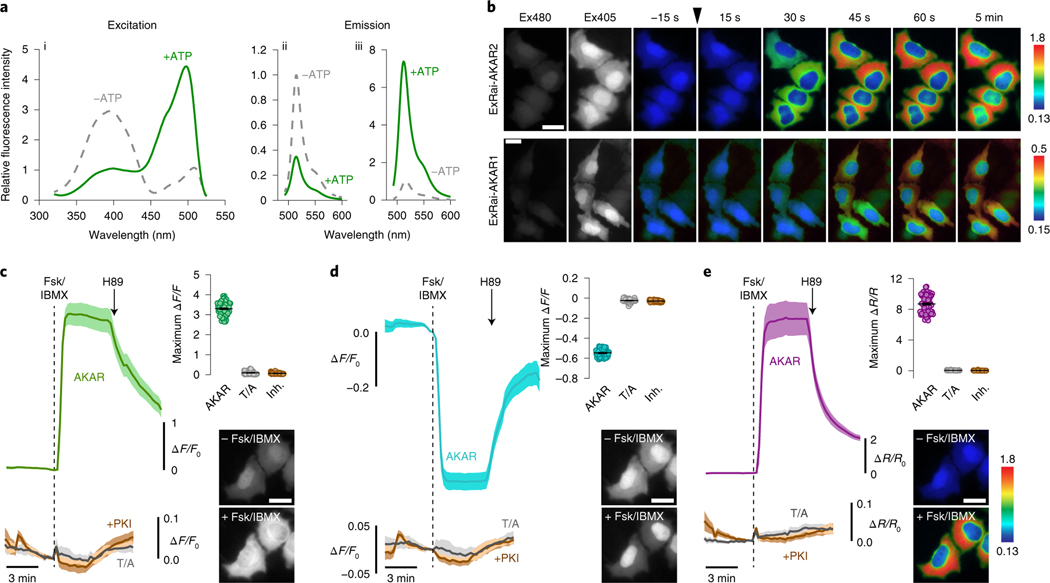
Fig. 1 |. Identification and characterization of ExRai-AKAR2.
a, Representative ExRai-AKAR2 fluorescence spectra collected at 530 nm emission (i) and 400 nm (ii) or 480 nm excitation (iii) without (gray traces) or with (green traces) ATP in the presence of PKA catalytic subunit. n = 3 independent experiments. b, Representative pseudocolored images showing the responses of ExRai-AKAR2 and ExRai-AKAR1 to Fsk/IBMX stimulation in HeLa cells. Excitation at 480 nm (Ex480) and at 405 nm (Ex405) images to the left show probe fluorescence at the beginning of the experiment. The arrowhead indicates the time when drug was added. Images are representative of three independent experiments for each sensor. c–e, Average timecourses (left) and maximum Ex480 (c), Ex405 (d) or 480/405 ratio responses (e) (right, top) in HeLa cells expressing ExRai-AKAR2 (AKAR, green, teal or purple curve; n = 70 cells), a negative-control phospho-acceptor mutant (T/A, gray curves; n = 59 cells) or ExRai-AKAR2 plus a PKA inhibitor construct (+PKI, brown curves; n = 51 cells) and treated with 50 μM Fsk/100 μM IBMX (Fsk/IBMX). Timecourses are representative of and maximum responses are combined from three independent experiments. Solid lines indicate mean responses; shaded areas, s.d. Images show ExRai-AKAR2 Ex480 (c), Ex405 fluorescence (d) or 480/405 nm excitation ratio (e) (pseudocolored) before and after stimulation. Warmer colors in b and e indicate higher ratios. All scale bars, 10 μm.

