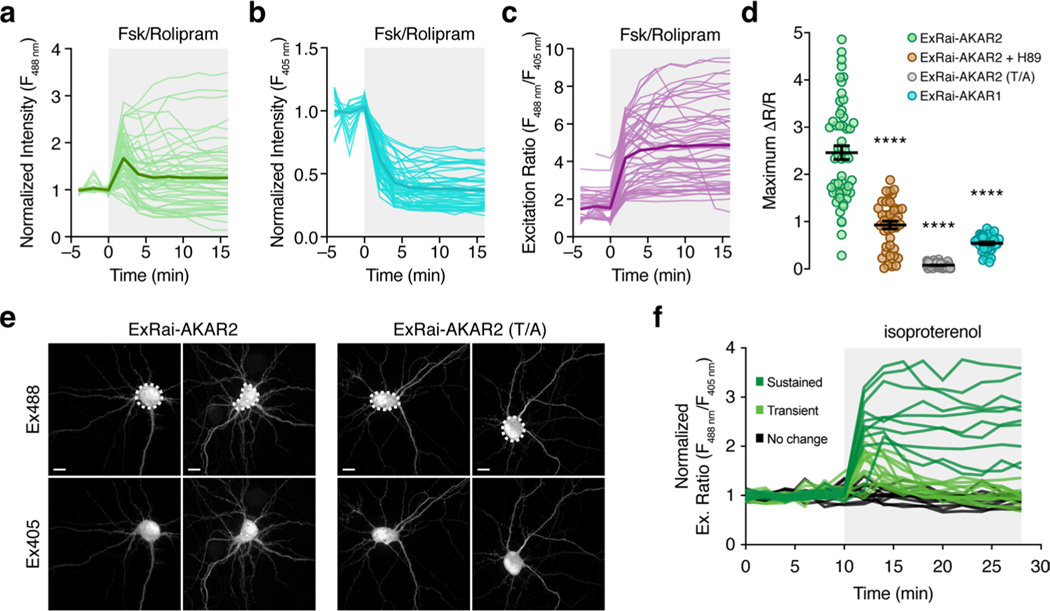
Extended Data Fig. 6 |. Imaging PKA activity using ExRai-AKAR2 in cultured hippocampal neurons.
a–c, Time-course plots showing all individual traces of the PKA-induced change in ExRai-AKAR2 fluorescence in hippocampal neurons stimulated with 50 μM Fsk and 2 μM rolipram (Rol) at 488-nm (a) and 405-nm (b) laser excitation, along with the raw 488 nm/405 nm excitation ratio (c). Thick lines indicate mean responses, and thin lines depict individual single-cell traces. d, Summary of the maximum Fsk/Rol-stimulated ExRai-AKAR responses in cultured hippocampal neurons. Error bars represent mean±s.e.m. Data in d correspond to time-courses shown in Fig. 3a. n = 54 (ExRai-AKAR2), 63 (ExRai-AKAR2[T/A]), 41 (ExRai-AKAR2 + H89) and 40 (ExRai-AKAR1) cells. ****P < 0.0001 vs. ExRai-AKAR2, Welch’s ANOVA followed by Dunnett’s test for multiple comparisons. e, Representative confocal fluorescence images of the 488 nm (Ex488) and 405 nm (Ex405) channels for hippocampal neurons expressing ExRai-AKAR2 (left) or ExRai-AKAR2[T/A] (right), illustrating the selection of ROIs (dashed white lines) for experiments reported in Fig. 4a–c. Scale bars, 10 μm. f, Plot of ExRai-AKAR2-expressing neurons showing heterogeneous PKA responses of individual neurons treated with 1 μM isoproterenol, representing 36 neurons from one of three independent experiments shown in Fig. 4b.

