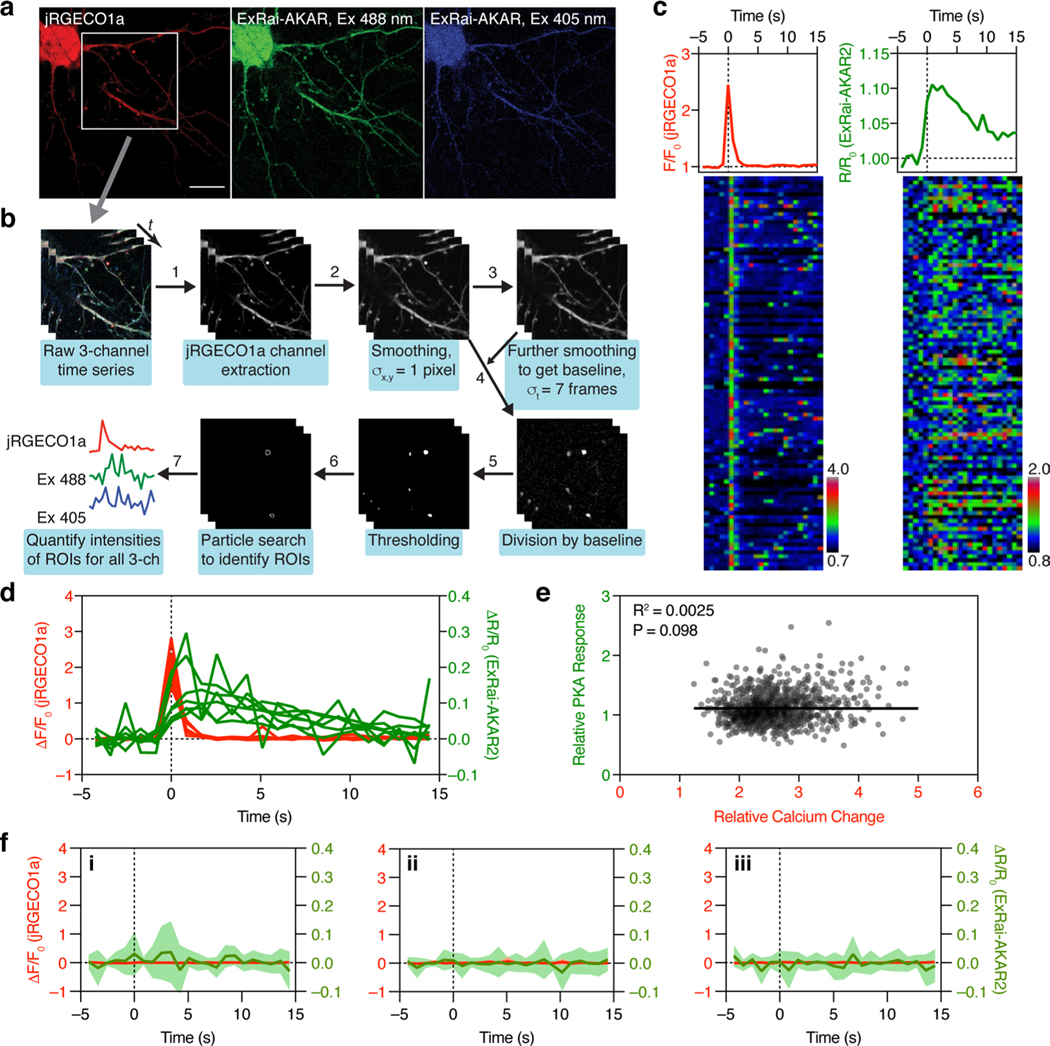
Extended Data Fig. 7 |. Correlated Ca2+ and PKA dynamics during LTP in cultured hippocampal neurons.
a, Representative confocal fluorescence images of the 561 nm (jRGECO1a, red), 488 nm (Ex488, green), and 405 nm (Ex405, blue) channels for hippocampal neurons co-transfected with ExRai-AKAR2 and jRGECO1a, for experiments reported in Fig. 4d. Scale bar, 20 μm. b, Flow chart showing how Ca2+ transients were identified and how ROIs were drawn. c, (upper) Average responses of jRGECO1a (red) and ExRai-AKAR2 (green) for the neuron shown in (a). (lower) Color-coded time-courses of the jRGECO1a (left) and ExRai-AKAR2 (right) responses for 100 representative Ca2+ transients presented as raster plots. Each row represents one ROI. d, Responses of jRGECO1a (red) and ExRai-AKAR2 (green) in all 7 hippocampal neurons aligned to the peaks of Ca2+ transients. e, Relationship of relative PKA response and calcium influx from 1108 events in 7 neurons. Pearson correlation is not significant (P = 0.098, R2 = 0.0025). f, Aligning average responses from jRGECO1a (red) and ExRai-AKAR2 (R488/405, green) to randomly selected time points in the recording shows that PKA transients are specifically triggered by Ca2+ spikes. Three randomizations were performed using the 7 cells from 3 separate experiments. Solid lines indicate mean responses from 7 cells; shaded areas, s.d.

