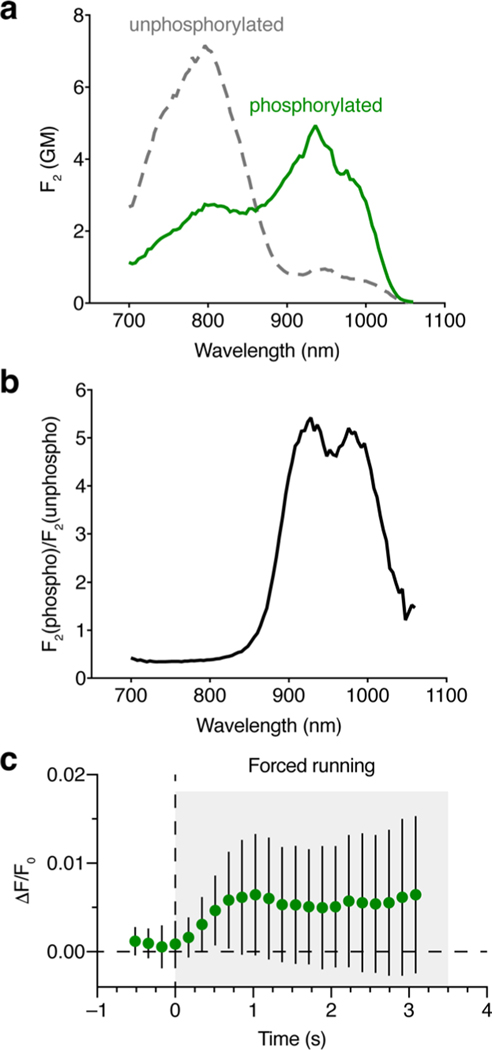
Extended Data Fig. 8 |. In vivo imaging of PKA activity using ExRai-AKAR2.
(a, b) Two-photon characterization of ExRai-AKAR2. a, Two-photon excitation spectra of purified ExRai-AKAR2 in the unphosphorylated (gray curve) and phosphorylated (green curve) states. The spectra are presented in molecular two-photon brightness values, F2, measured in GM (see Methods for details). Each spectrum consists of two overlapping bands – one belonging to the neutral form (peaking at 800 nm) and another belonging to the anionic form (peaking near 940 nm). n = 3 independent experiments. b, Ratio of the F2 values for phosphorylated and unphosphorylated ExRai-AKAR2. The ratio shows two peaks: at 930 nm (5.4) and 980 nm (5.1). The presence of two peaks is explained by a slight shift of the anionic two-photon absorption band upon phosphorylation (from 948 to 936 nm). Although excitation at 930 nm is the best for two-photon imaging, the whole range from 905 to 1000 nm provides a good contrast with F2(phospho)/F2(unphopsho) >4.6. c, Sub-second response latencies for ExRai-AKAR2 following the onset of forced locomotion. Data from Fig. 5e are re-plotted here at higher temporal frequency. Significant deviations from baseline are detected as early as 350 ms (P = 0.0116, one-tailed one-sample t-test against baseline=0; P = 0.0364, paired one-tailed t-test with Welch’s correction against last baseline point at t = 0). Error bars indicate s.d..

