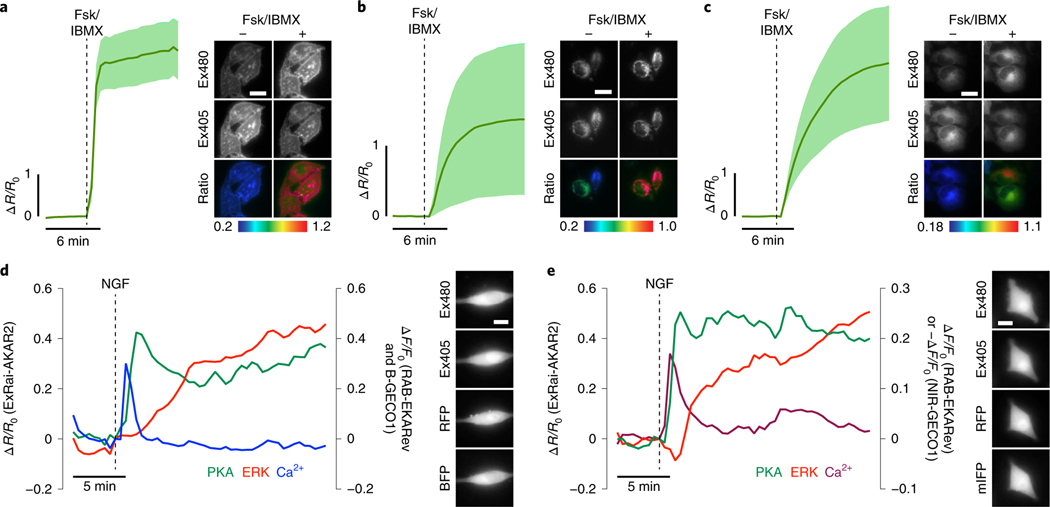
Fig. 2 |. Subcellular kinase activity detection and multiplexed imaging using ExRai-AKAR2.
a-c, Live-cell timecourses of 480/405 nm excitation-ratio responses from plasma membrane- (a), outer mitochondrial membrane- (b) or endoplasmic reticulum-targeted ExRai-AKAR2 in HeLa cells (c) stimulated with 50μM Fsk and 100μM IBMX (Fsk/IBMX). n = 15 (pmExRai-AKAR2), 14 (mitoExRai-AKAR2) and 17 cells (erExRai-AKAR2) and are representative of three, four and three independent experiments, respectively. Solid lines indicate mean responses; shaded areas, s.d. Images show the Ex480 and Ex405 intensity, as well as the 480/405nm excitation ratio (pseudocolored), before and after stimulation (see also Extended Data Fig. 3). d,e, Representative single-cell traces showing three-color multiplexed imaging of PKA, ERK and Ca2+ dynamics using ExRai-AKAR2 (green trace), RAB-EKARev (red trace) and either B-GECO1 (d) (blue trace) or NIR-GECO1 (e) (magenta trace) in PC12 cells stimulated with 200 ngml−1 of NGF. Curves are representative of eight cells from eight experiments for each combination. Representative images of each channel are shown to the right. Traces from additional cells are shown in Supplementary Fig. 4 and 5. Scale bars in a-e, 10 μm.

