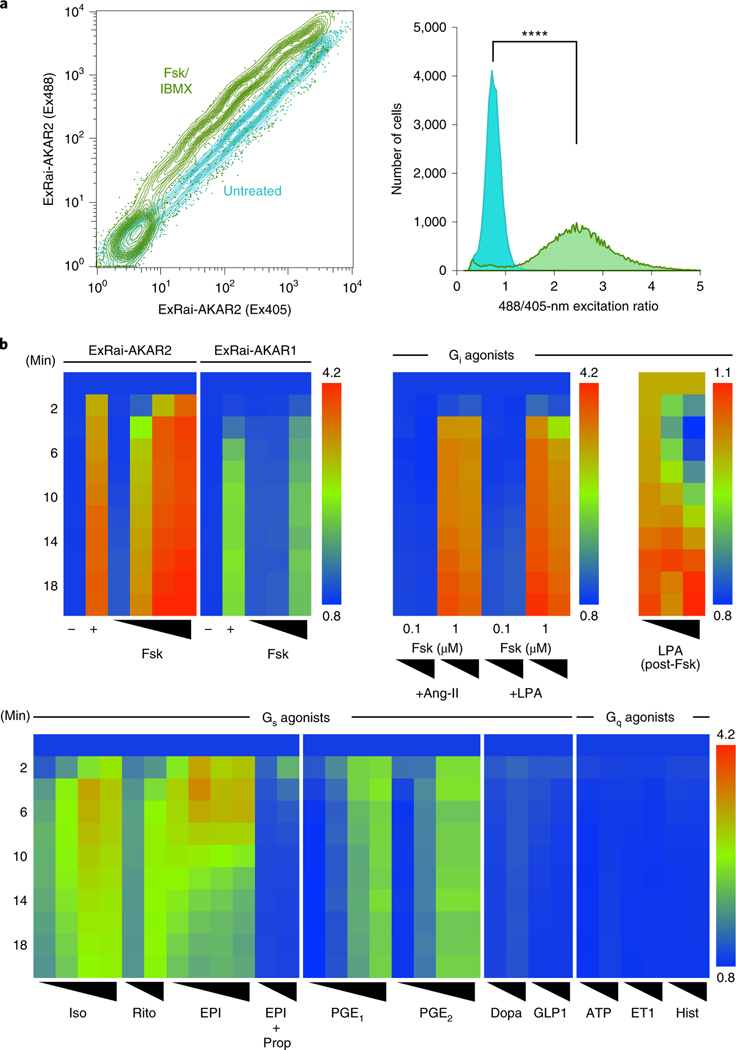
Fig. 3 |. ExRai-AKAR2 permits robust, multi-modal detection of live-cell PKA activity.
a, Flow cytometric measurement of PKA activity in HEK293T cells using ExRai-AKAR2. Left, contour plot showing 488- and 405-nm-excited fluorescence intensities of transfected cells without (teal) and with (green) Fsk/IBMX stimulation. Right, frequency distribution of 488/405 nm excitation ratio illustrating the significant population shift caused by stimulation (****P< 0.0001, two-tailed Kolmogorov–Smirnov test). Data are representative of three independent experiments. See also Extended Data Fig. 4 and Supplementary Fig. 6. b, Heatmap showing excitation-ratio timecourses recorded on a fluorescence plate reader in HEK293T cells expressing ExRai-AKAR2 or ExRai-AKARI as indicated. Upper left, ExRai-AKAR2 versus ExRai-AKARI: untreated (–); 50 μM Fsk plus 100 μM IBMX (+); Fsk dose series (10 nM, 100 nM, 1 μM, 15 μM for ExRai-AKAR2 and 100 nM, 1 μM, 15 μM for ExRai-AKARI). Upper right, ExRai-AKAR2 with Gi-coupled receptor agonists: Fsk (100 nM, 1 μM) costimulation with angiotensin II (Ang-II; 1 μM, 10 μM) or LPA (50 nM, 500 nM); LPA dose series (control, 50 nM, 1 μM following 100 nM Fsk for 20 min). Bottom, ExRai-AKAR2 with Gs- or Gq-coupled receptor agonists: Iso (5 nM, 10 nM, 20 nM, 50 nM); epinephrine (EPI) (100 nM, 500 nM, 1 μM, 10 μM); EPI (1 μM, 10 μM) with propranolol (Prop) (10 μM) costimulation; ritodrine (Rito) (1 μM, 10 μM); PGE1 (1 nM, 10 nM, 100 nM, 1 μM); PGE2 (1 nM, 10 nM, 100 nM, 1 μM); dopamine (Dopa) (1 μM, 10 μM); glucagon-like peptide 1 (GLP1) (10 nM, 20 nM); ATP (1 μM, 10 μM); endothelin 1 (ET1) (30 nM, 100 nM) and histamine (Hist) (1 μM, 10 μM). Warmer colors represent higher ratios/PKA activity. Data are averaged from three independent experiments (see also Supplementary Figs. 7 and 8).

