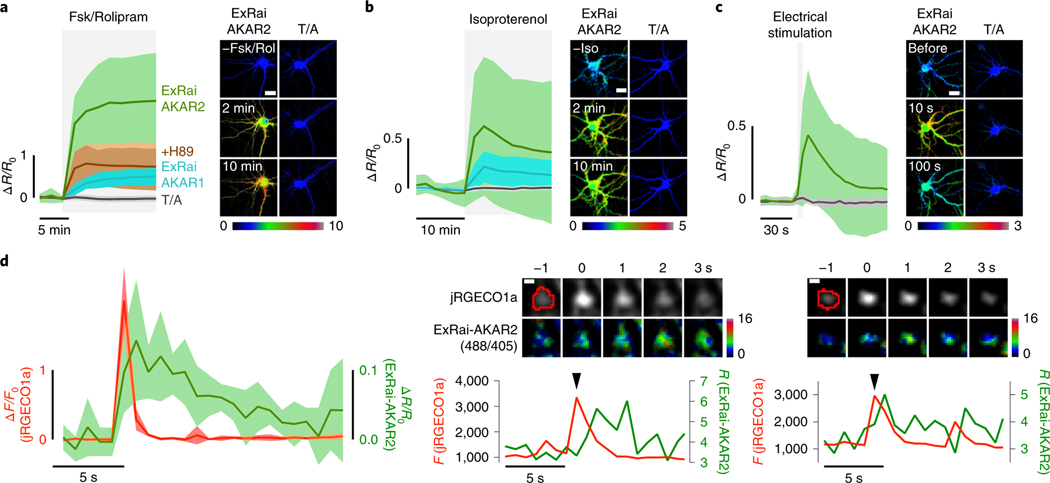
Fig. 4 |. PKA activity imaging in cultured neurons using ExRai-AKAR2.
a, Left, average timecourses in hippocampal neurons treated with 50 μM Fsk and 2 μM Rol. n = 54 (ExRai-AKAR2, green trace), 63 (ExRai-AKAR2(T/A), gray trace), 41 (ExRai-AKAR2 + H89, brown trace) and 40 (ExRai-AKAR1, teal trace) cells combined from four, four, three and three experiments, respectively. Right, images showing the Ex488/Ex405 excitation ratio (pseudocolored) before and after stimulation for ExRai-AKAR2 and ExRai-AKAR2(T/A). See also Extended Data Fig. 6. b, Left, average timecourses in hippocampal neurons treated with 1 μM Iso. n = 136 (ExRai-AKAR2, green trace), 129 (ExRai-AKAR2(T/A), gray trace) and 132 (ExRai-AKARI, teal trace) cells combined from three experiments each. Right, images showing the Ex488/Ex405 excitation ratio (pseudocolored) before and after stimulation for ExRai-AKAR2 and ExRai-AKAR2(T/A). See also Extended Data Fig. 6. c, Left, average timecourses in hippocampal neurons with electrical stimulation. n = 31 (ExRai-AKAR2, green trace) and 42 (ExRai-AKAR2(T/A), gray trace) cells combined from three experiments each. Right, images showing the Ex488/Ex405 excitation ratio (pseudocolored) before and after stimulation for ExRai-AKAR2 and ExRai-AKAR2(T/A). d, Left, average responses from jRGECO1a (red trace) and ExRai-AKAR2 (R488/405, green trace) aligned to Ca2+ peaks. n = 7 cells, representing three independent experiments. Middle and right; upper, representative images of an identified Ca2+ transient event and corresponding ExRai-AKAR2 ratio image with identified region of interest circled in red and lower, representative timecourses from jRGECO1a (red trace) and ExRai-AKAR2 (R488/405, green trace) corresponding to the Ca2+ transient event (arrow) from the pictured region. See also Extended Data Fig. 7. Solid lines in a-c,d (left) indicate mean responses; shaded areas, s.d. Scale bars, 20 μm (a-c) and 1 μm (d).

