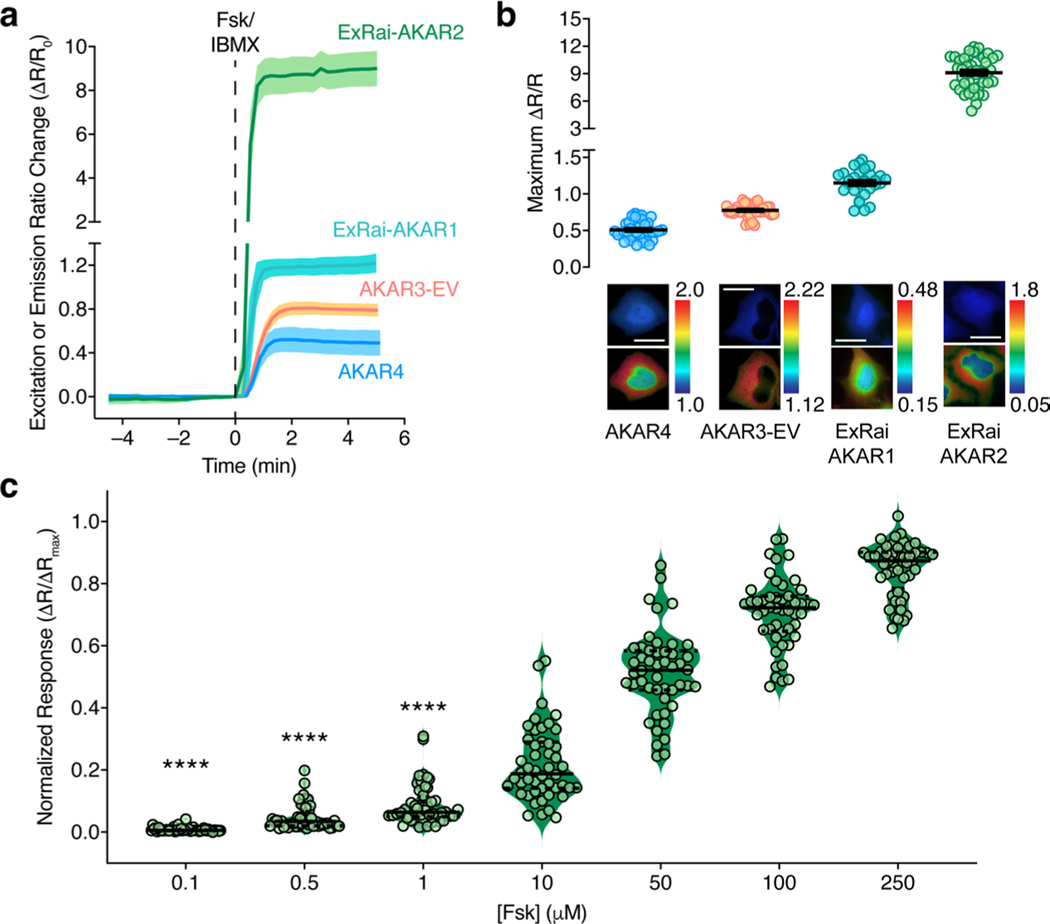
Extended Data Fig. 2 |. Comparing ExRai-AKAR2 performance with previous PKA sensors.
(a, b) Side-by-side comparison of ExRai-AKAR2 with existing intensity-ratio-based PKA sensors. a, Average time-course showing the enhanced ratio response (ΔR/R0) of ExRai-AKAR2 (n = 18) versus ExRai-AKAR1 (n = 11), AKAR4 (n = 18), and AKAR3-EV (n = 18) in HeLa cells stimulated with 50 μM Fsk and 100 μM IBMX (Fsk/IBMX). Solid lines indicate average responses; shaded areas, s.d. b, Summary of the maximum ratio changes (ΔR/R) for ExRai-AKAR2 (n = 44), ExRai-AKAR1 (n = 39), AKAR4 (n = 38), and AKAR3-EV (n = 36) following Fsk/IBXM stimulation. Representative pseudocolor images below the graph depict the raw emission (AKAR4, AKAR3-EV) or excitation ratio (ExRai-AKAR1, ExRai-AKAR2) before (upper) and after (lower) Fsk/IBMX stimulation. Warmer colors indicate higher ratios. Scale bars, 10 μm. Data are representative of (a) or combined from (b) 2 independent experiments. Error bars in b indicate mean±s.e.m. c, Fsk dose response of ExRai-AKAR2. HeLa cells expressing ExRai-AKAR2 (n = 48) were successively stimulated with the indicated concentrations of Fsk, followed by 100 μM IBMX. Data are plotted as ΔR/ΔRmax = (R[Fsk]−R0)/(RIBMX − R0), where R[Fsk] is the maximum ratio recorded after the addition of a given Fsk dose, RIBMX is the maximum ratio recorded following IBMX addition at the end of the experiment, and R0 is the ratio recorded immediately prior to the first drug addition (for example, t = 0). Data are combined from 2 independent experiments. Solid and dashed lines indicate the median and quartiles, respectively. ****P < 0.0001 vs. 0; two-tailed Wilcoxon signed-rank test.

