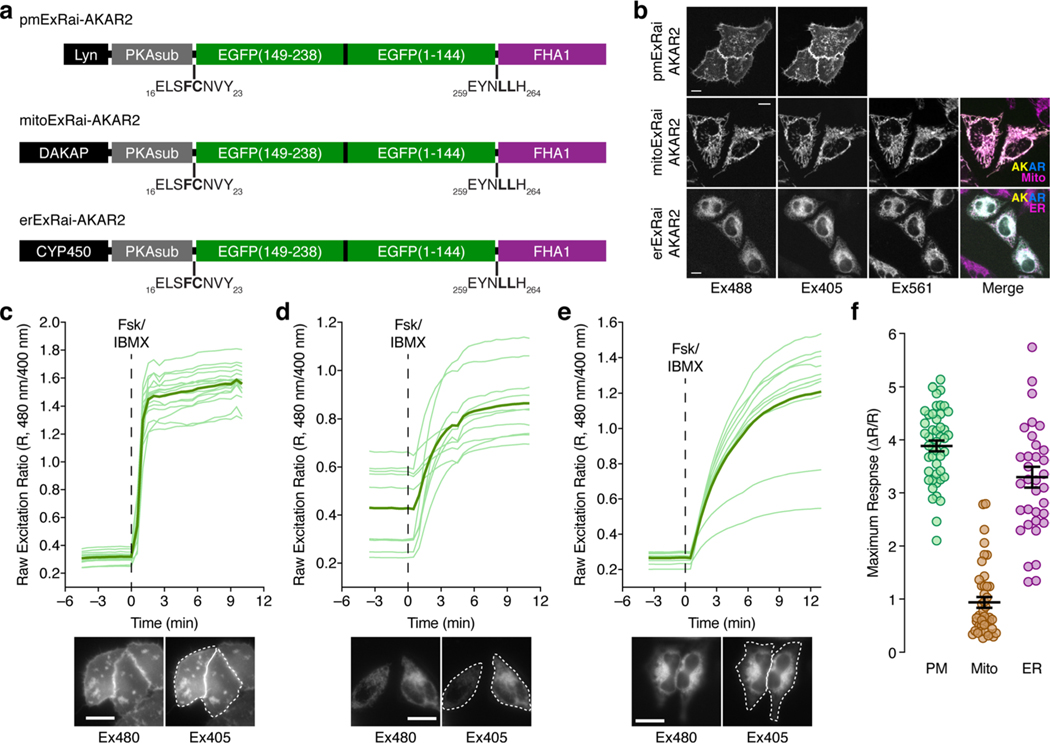
Extended Data Fig. 3 |. Detecting local PKA signaling with subcellularly targeted ExRai-AKAR2.
a, Domain structures of ExRai-AKAR2 constructs targeted to the plasma membrane, outer mitochondrial membrane, and ER membrane. b, Representative confocal fluorescence images showing the plasma membrane, mitochondrial, and ER localization of pmExRai-AKAR2, mitoExRai-AKAR2, and erExRai-AKAR2, respectively, in both excitation channels (Ex488, Ex405). For mito- and erExRai-AKAR2, images of the red fluorescence signal (Ex561) from MitoTracker RED and ER-Tracker RED, respectively, are also shown. Merged images (far right) depict the overlay of the Ex488 (yellow), Ex405 (cyan), and Ex561 (magenta) channels. Images are representative of 2 independent experiments per condition. c–e, Time-course plots showing all individual traces corresponding to the raw 480/405 excitation ratio responses of pmExRai-AKAR2 (left), mitoExRai-AKAR2 (middle), and erExRai-AKAR2 (right), along with representative epifluorescence images of both excitation channels (below) illustrating ROI selection (dashed white lines), for the experiments shown in Fig. 2a–c. Thick lines indicate mean responses, and thin lines depict individual single-cell traces. Scale bars in b–c, 10 μm. f, Summary of the maximum excitation ratio changes (ΔR/R) for pmExRai-AKAR2 (PM; n = 46 cells from 3 experiments), mitoExRai-AKAR2 (Mito; n = 43 cells from 4 experiments), and erExRai-AKAR2 (ER; n = 35 cells from 3 experiments) in HeLa cells stimulated with Fsk/IBMX. Error bars in d indicate mean±s.e.m.

