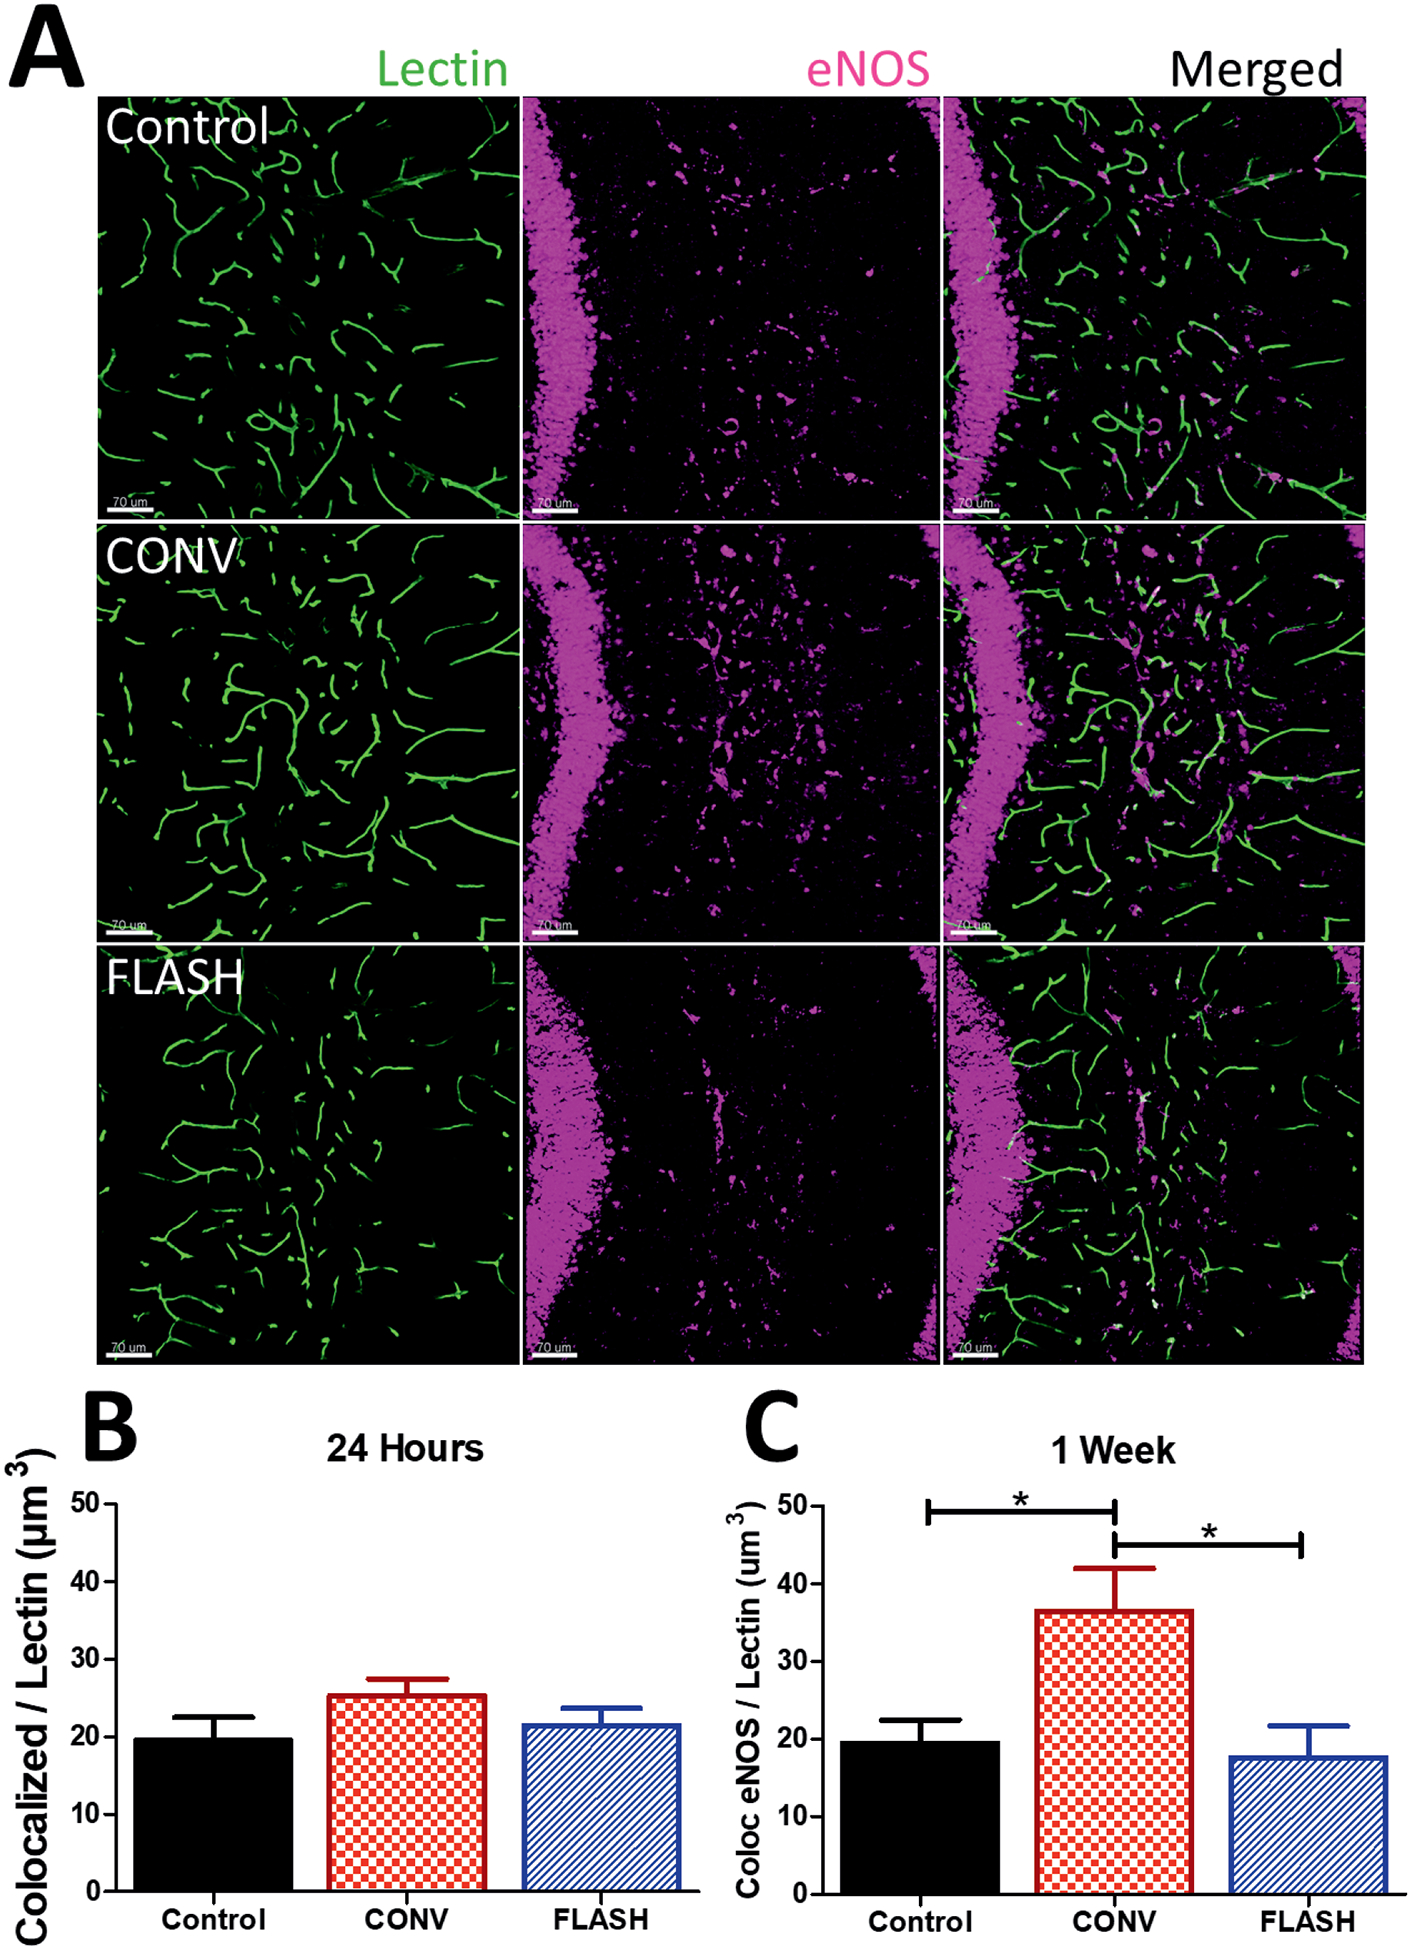
FIG. 2.

FLASH did not elevate vascular eNOS in the brain. Volumetric analysis of eNOS colocalized with lectin was performed. Panel A: Representative images of eNOS immunoreactivity were converted to 3-D renderings using Imaris at one week postirradiation. Scale bars = 70 μm. Panels B and C: Quantitative analysis of eNOS colocalized within 5 μm of lectin-stained microvasculature at 24 h and one week. CONV increased levels of eNOS-lectin at one week compared to control and FLASH. Data shown are the mean ± SEM (n = per group, two images analyzed per animal). *P < 0.05 (ANOVA with Bonferroni’s multiple comparisons test).
