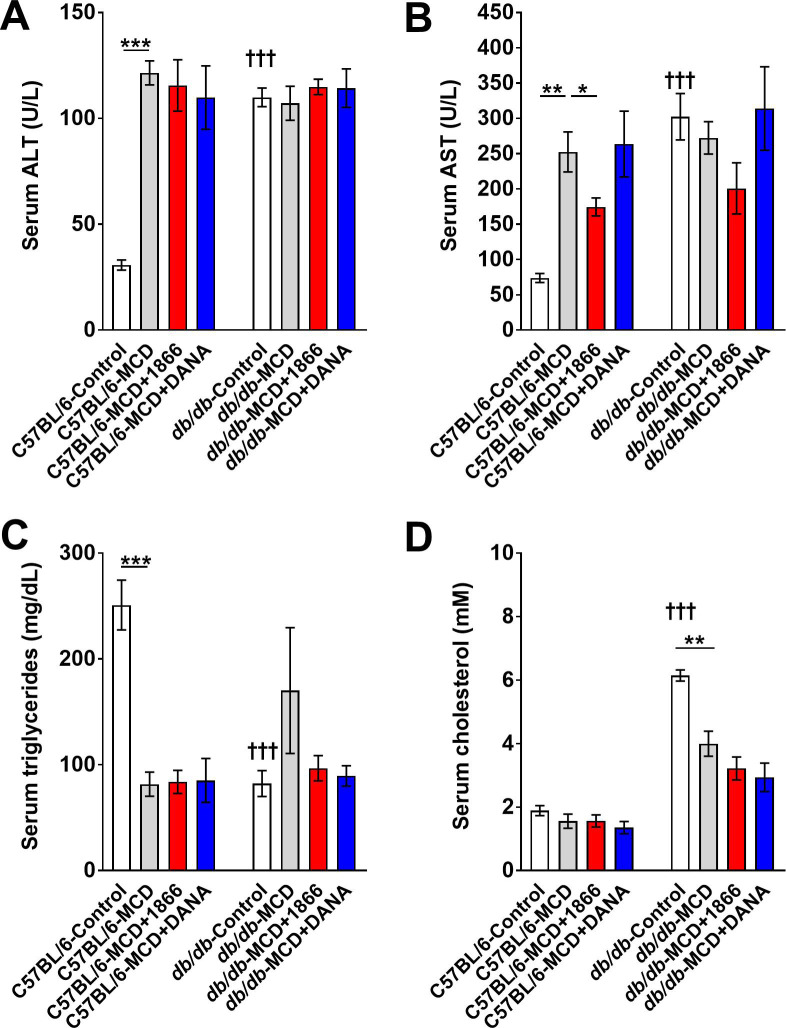
Fig 6. Quantification of serum ALT, AST, and lipids.
Serum from C57BL/6 and db/db mice was assessed for A) ALT, B) AST, C) triglycerides or D) cholesterol. * indicates p<0.05, ** indicates p < 0.01, *** p < 0.001 (one-way ANOVA, Sidak’s test). ††† indicates p<0.001 comparing C57BL/6 and db/db mice on control diet (t-test).

