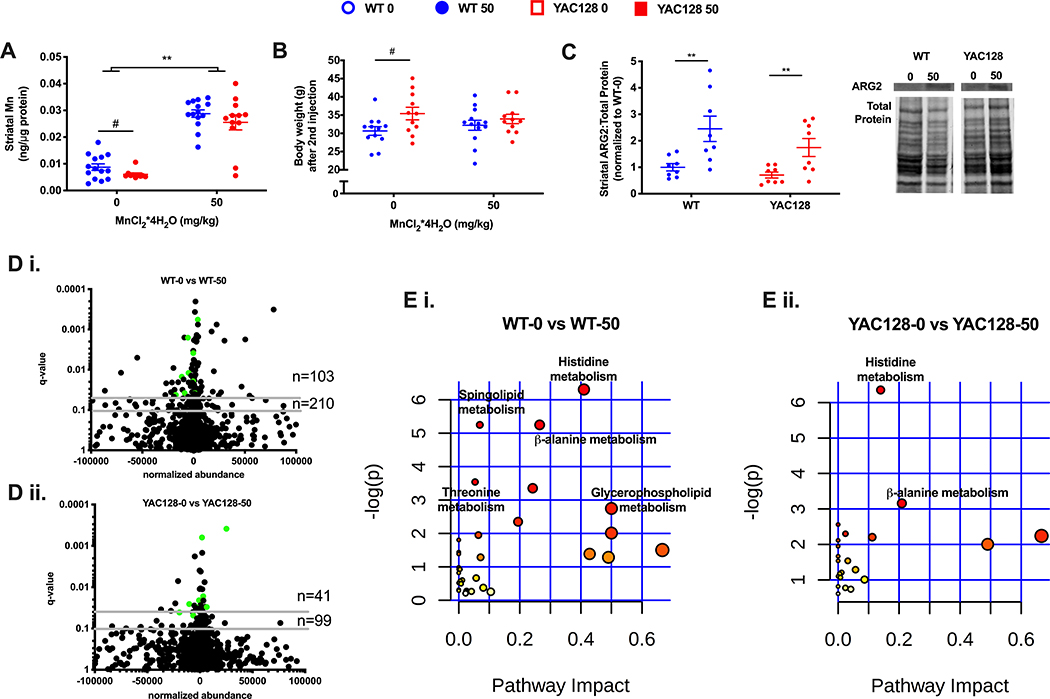
figure 3.
the effect of 1-week long mn exposure in aged mice on striatal mn (a), body weight (b), arginase 2 protein levels (c), striatal metabolome (d), and metabolic pathways (e) enriched in the striatum. data represented in a, b, and c as the mean ± sem and n=10–14 and an asterisk (*) indicates a mn effect and a hashtag (#) indicates a genotype effect at significance level of p<0.05. changes in the striatal metabolome (d) depicted in volcano plots indicate metabolites altered at q-value<0.05 and q-value<0.10 with horizontal grey lines. n=103 and n=210 indicate the number of significantly altered metabolites in wt (d i.) at q-value <0.05 and q-value 0.10, respectively. n=41 and n=99 indicate the number of significantly altered metabolites in hd (d ii.) at q-value <0.05 and q-value 0.10, respectively. the number of significantly altered metabolites is greater in wt than hd, χ2=14.0, df=1, p<0.001. green dots indicate those significantly altered metabolites in both wt and hd (15 metabolites). pathway analysis of striatal metabolites (e) indicates similar metabolic pathways. colored dots ranging from yellow to red indicate increasing significance by -log(p-value); biological pathways significantly enriched (p<0.05) are annotated. pathway impact relates to the ability of enriched metabolites to impact additional compounds within that pathway. circle color (yellow -> red) and circle size (small -> large) reflect an increasing pathway impact and −log (p-value), respectfully. metabolomic data represent feature changes in n=10-14 for each genotype and exposure.

