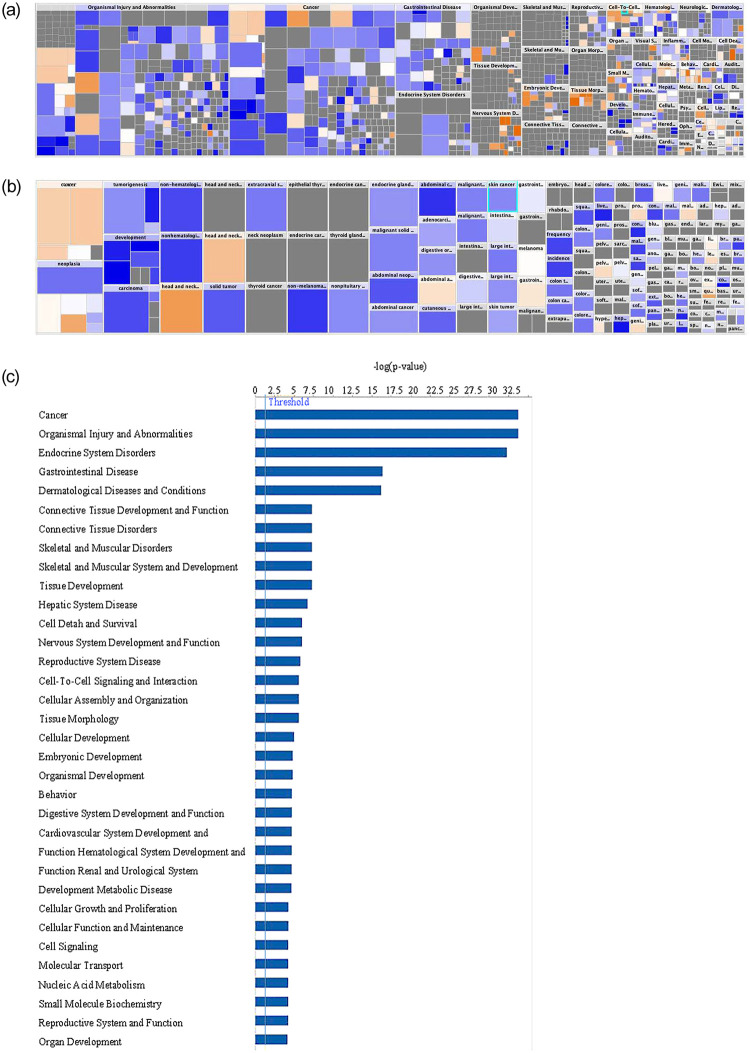
Fig 5. Gene network analysis between DACH1 mutated and wild-type patients.
(A) A heatmap of the network analysis of genes differentially expressed between DACH1 mutated patients and wild-type by organ and disease system pathways is shown. The size of the box denotes the -log(p-value). The color of the boxes correlates with the z-score with the intensity of blue representing z ≤ 0 and orange z ≥ 0. Those with the highest z-scores and the greatest p-values include head and neck cancer, head and neck tumor, cancer of secretory structure, and neoplasia of cells. (B) Heatmap of network analysis separated by cancer disease process is shown. This shows an increased z-score in secretory cancers (-log[p-value] = 31.281, z-score = 0.547), head and neck cancers (-log[p-value] = 33.233, z-score = 1.463), abdominal adenocarcinoma (-log[p-value] = 16.306, z-score = 0.328), pelvic cancer (-log[p-value] = 5.439, z-score = 0.391), hyperplasia of the intestinal tract (-log[p-value] = 2.818, z-score = 0.239), prostate cancer (-log[p-value] = 4.883, z-score = 0.291), genital cancer (-log[p-value] = 3.967, z-score = 0.391), and quantity of malignant tumor (-log[p-value] = 2.502, z-score = 1.254). (C) Disease system pathways involved with DACH1 mutations are shown through network analysis of genes differentially expressed between DACH1 mutated patients and wild-type.

