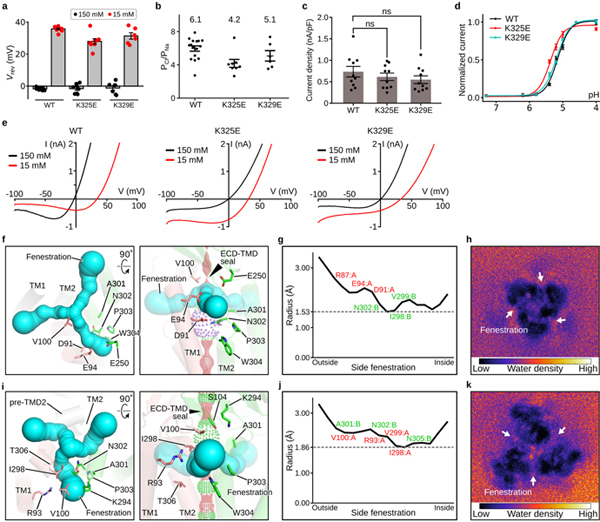
Extended Data Figure 8: Lateral fenestration and ion selectivity of PAC.

a, The reversal potential (Vrev) of PAC WT, K325E, and K329E at 150 mM NaCl (black) or 15 mM NaCl (red) in the bath solution (internal solution contains 150 mM NaCl). The bar graph represents the mean and standard error (WT[n=16], K325E[n=8], and K329E[n=6]). Individual data points are shown as dots (The same data points for WT were also used in Fig. 3i for comparison with K319E). b, The relative Cl-/Na+ permeability for PAC WT[n=16], K325E[n=8], and K329E[n=6] calculated from the pH 5-induced current at 100 mV. The center and error bar represent the mean and standard error of the permeability ratio. Individual data points are shown as solid dots (The same data points for WT were also used in Fig. 3j for comparison with K319E). The average PCl/PNa permeability values are indicated for each construct. c, The current density of PAC WT[n=10], K325E[n=10], and K329E[n=10] at pH 4.6 with a holding potential of 100 mV. The bar graph shows the average normalized current density +/− standard error. One-way analysis of variance (ANOVA) with Bonferroni post hoc test was used to determine the significance (p-value is 0.832 and 0.416 for K325E and K329E, respectively). D’Agostino & Pearson omnibus test was performed to check the normality of the data (p-value is 0.255, 0.153, and 0.293 for WT, K325E, and K329E, respectively). ns indicates a p-value>0.05. d, The pH dose-response curve of WT PAC, K325E, and K329E. The currents are normalized to those at pH 4.6 (n=8 for WT PAC; n=6 for K325E; n=7 for K329E). The currents at different pH are represented by the average normalized currents +/− standard error. A non-linear fitting to a sigmoidal dose-response curve is generated for each construct. e, The representative whole-cell patch clamp recording at pH 5.0 with 150 mM NaCl pipette solution and 150 mM (black) or 15 mM NaCl (red) bath solutions. The current-voltage relationship of WT (left), K325E (middle) and K329E (right) PAC in two different bath solutions are plotted. The same WT traces were also shown in the left panel of Fig. 3j for comparison with K319E. f and i, The pH8–PAC and pH4–PAC extracellular fenestration viewed from the extracellular side (left) and parallel to the membrane (right), respectively. Residues forming the fenestration are shown in sticks, including three negatively charged residues (D91, E94 and E250) for pH8–PAC and two positively charged residues (R93 and K294) for pH4–PAC. g and j, the radius of the fenestration tunnel estimated by CAVER 3.0 for pH8–PAC (g) and pH4–PAC (j). The horizontal line marks the smallest radius along the tunnel. The residues lining the fenestration tunnel are marked. h and k, The fenestration water density plot of pH8–PAC (h) and pH4–PAC (k) from a 100-ns molecular dynamics simulation. Water molecules in the Z range of the side fenestration site are projected to the X/Y plane and are shown as a 2D histogram.
