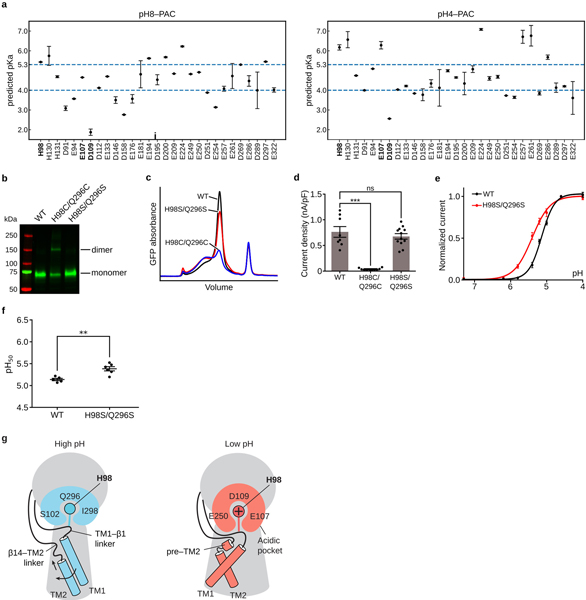
Extended Data Figure 9: H98 is involved in PAC pH sensing.
a, The pKa prediction of titratable residues for the pH8 and pH4 structures of human PAC. The mean and error bar (standard deviation) are calculated based on 1000 fixed backbone rotamer ensembles generated from each structure (see Methods). b, A SDS-gel of GFP-tagged PAC WT, H98C/Q296C, and H98S/Q296S. A dimeric band is observed for H98C/Q296C mutant, but not for WT and H98S/Q296S. The unedited source gel of the image can be found in Supplementary Fig. 1c. The gel was independently repeated twice with similar results. c, The FSEC profile of GFP-tagged PAC WT, H98C/Q296C, and H98S/Q296S solubilized using GDN detergent. d, The whole-cell current density of PAC WT, H98C/Q296C, and H98S/Q296S recorded at pH 5.0 at 100 mV. The bar graph shows the average current density (nA/pF) +/− standard error. Each individual data point represents a cell (WT[n=8], H98C/Q296C[n=10], and H98S/Q296S[n=12]). Two-tail unpaired t-test was used to determine the difference in current density compared to WT (p-value is 1.08E-6 for H98C/Q296C and 0.321 for H98S/Q296S). D’Agostino & Pearson omnibus test was performed to check the normality of the data (p-value is 0.328, 0.154, and 0.727 for WT, H98C/Q296C, and H98S/Q296S, respectively). e, The pH dose-response curve of WT PAC and H98S/Q296S. The currents are normalized to those at pH 4.6 (n=5 for WT PAC; n=6 for H98S/Q296S). A non-linear fitting to a sigmoidal dose-response curve is generated for each construct. Bar plot shows the mean +/− standard error. f, The pH50 of PAC WT and H98S/Q296S estimated from the pH dose-response curve. The center and bar represent the estimated pH50 and standard error from the non-linear fitting in (e). Two-tail Mann-Whitney test was used to determine the significance (p-value is 0.0087). g, The proposed pH sensing mechanism for PAC. At high pH, the deprotonated H98 is surrounded by Q296, S102, and I298, and TM1 pairs with TM2 from the same subunit. At low pH, the protonated H98 undergoes a conformational change and moves into an acidic pocket. As a result, the TM1 dissociates from the resting interface and rotates to interact with TM2 of the adjacent subunit. For all panels, ns indicates a p-value>0.05.; ** denotes p-value between 0.01 and 0.0001; *** denotes a p-value<0.001; n represents measurement from biologically independent cells.

