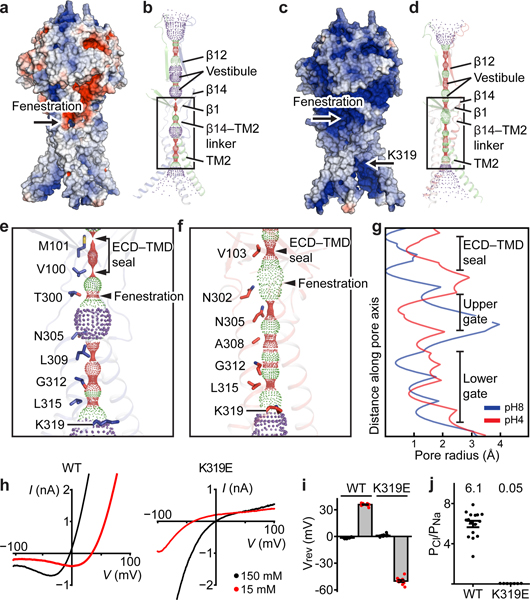
Figure 3: Ion-conducting pathways and anion selectivity.
a and c, pH8–PAC and pH4–PAC in surface representation colored according to the electrostatic surface potential from –3 to 3 kT/e (red to blue). Titratable residues are assigned to their predominant protonation state at pH 8 (a) or 4 (c) based on propka. b and d, The pore profiles of pH8–PAC and pH4–PAC model along the symmetry axis. Pore-lining residues are shown. e and f, Enlargements of the boxed areas in panels (b) and (d), respectively. The positions of ECD-TMD seal and fenestration site are labeled. g, Pore radius plots of the profiles in (e) and (f). h, The representative current-voltage relationship of PAC WT and K319E. The pipette solution contains 150 mM NaCl; the bath solution contains 150 mM (black) or 15 mM NaCl (red). i, The reversal potential of PAC WT and K319E from recordings in (h). The bar graph represents the mean and standard error (WT[n=16] and K319E[n=7). Individual data points are shown as dots. j, The relative Cl-/Na+ permeability for PAC WT[n=15] and K319E[n=11] calculated from pH 5 -induced current at 100 mV. The center and error bar represent the mean and standard error of the permeability ratio. Individual data points are shown as solid dots. The average PCl/PNa permeability values are indicated at the top for each construct.

