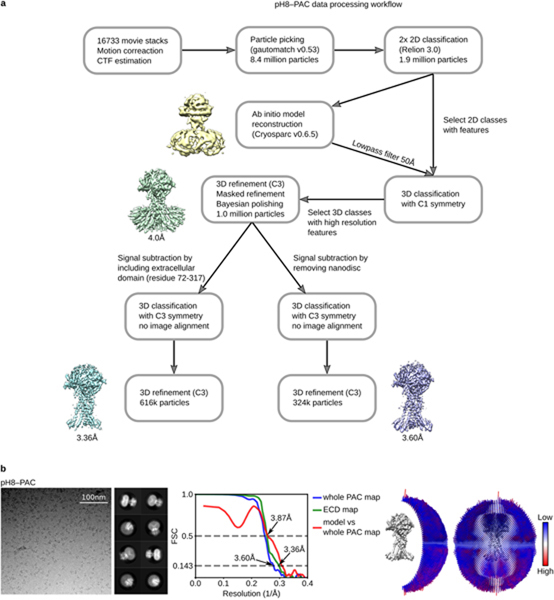
Extended Data Figure 2: The workflow of cryo-EM data processing of pH8–PAC and data statistics.

a, A total of 16733 raw movies stacks were collected and processed with motion correction, CTF estimation, and particle picking. Particles were subjected to two rounds of 2D classification and a 3D classification run to obtain a homogeneous particle set. To further sort out conformational heterogeneity, we attempted to subtract and classify 1) particles without nanodiscs and 2) the extracellular domain (ECD) of PAC (residues 72–317) by using a mask. Subsequent refinement allowed us to obtain a map at 3.60 Å resolution for the entire PAC protein and 3.36 Å resolution for the ECD. b, Representative micrograph, 2D class averages, Fourier shell correlation (FSC) curves, and angular distribution of particles used for 3D reconstruction for pH8–PAC dataset. The gold-standard 0.143 threshold was used to determine map resolution based on the FSC curve. The threshold for model versus map correlation was 0.5 to determine the resolution.
