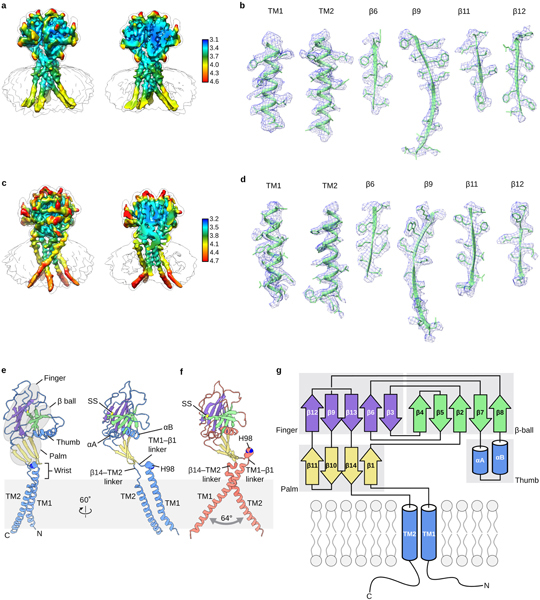
Extended Data Figure 4: Local resolution/densities of cryo-EM maps and domain organization of human PAC.

a, The local resolution of the pH8–PAC map. A non-sliced (left) and a sliced (right) view of the map viewed parallel to the membrane are shown. The unit for the color key is Å. b, Representative densities of several secondary structural elements of pH8–PAC. The atomic model is overlaid with the density to show the side chain information. c, The local resolution of the pH4–PAC map. A non-sliced (left) and a sliced (right) view of the map viewed parallel to the membrane are shown. The unit for the color key is Å. d, Representative densities of several secondary structural elements of pH4–PAC. The atomic model is overlaid with the density to show the side chain information. e, The pH8–PAC single subunit viewed parallel to the membrane. The wrist, palm, thumb, finger and β-ball domains are highlighted. f, The pH4–PAC single subunit viewed in the same orientation as the right image of panel e. g, Domain organization of PAC. Clusters of secondary structure that form the palm, finger, thumb, and β-ball domains are labeled.
